| __timestamp | Cintas Corporation | Masco Corporation |
|---|---|---|
| Wednesday, January 1, 2014 | 793811000 | 899000000 |
| Thursday, January 1, 2015 | 877761000 | 1041000000 |
| Friday, January 1, 2016 | 933728000 | 1220000000 |
| Sunday, January 1, 2017 | 968293000 | 1314000000 |
| Monday, January 1, 2018 | 1227852000 | 1240000000 |
| Tuesday, January 1, 2019 | 1564228000 | 1244000000 |
| Wednesday, January 1, 2020 | 1542737000 | 1410000000 |
| Friday, January 1, 2021 | 1773591000 | 1185000000 |
| Saturday, January 1, 2022 | 1990046000 | 1490000000 |
| Sunday, January 1, 2023 | 2221676000 | 1493000000 |
| Monday, January 1, 2024 | 2523857000 | 1410000000 |
Unlocking the unknown
In the ever-evolving landscape of corporate finance, understanding EBITDA trends is crucial for investors and analysts alike. This analysis delves into the EBITDA performance of Cintas Corporation and Masco Corporation from 2014 to 2023. Over this decade, Cintas has demonstrated a remarkable growth trajectory, with its EBITDA increasing by approximately 218%, from $794 million in 2014 to an impressive $2.22 billion in 2023. This consistent upward trend highlights Cintas's robust operational efficiency and strategic growth initiatives.
Conversely, Masco Corporation's EBITDA growth has been more modest, with a 66% increase over the same period, reaching $1.49 billion in 2023. Notably, Masco's EBITDA data for 2024 is missing, which could indicate a reporting delay or other factors. This comparative analysis underscores the importance of strategic planning and market adaptability in achieving sustained financial growth.
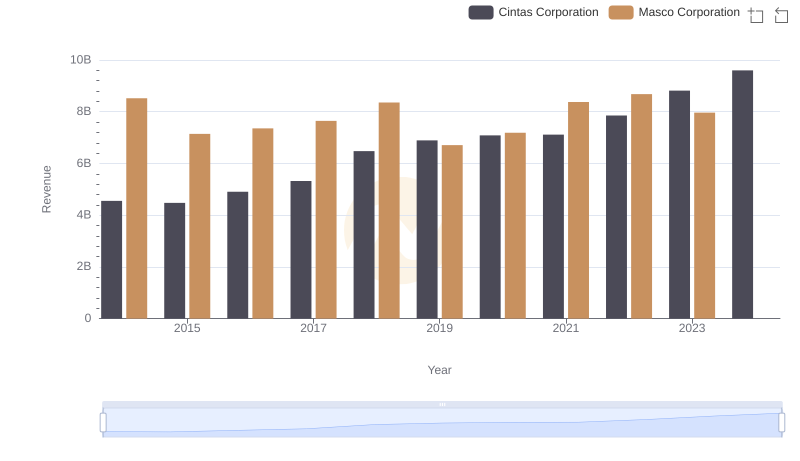
Who Generates More Revenue? Cintas Corporation or Masco Corporation
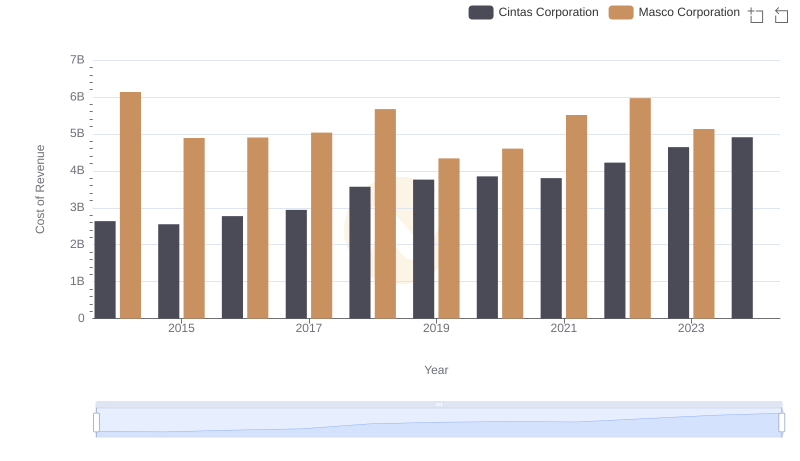
Comparing Cost of Revenue Efficiency: Cintas Corporation vs Masco Corporation
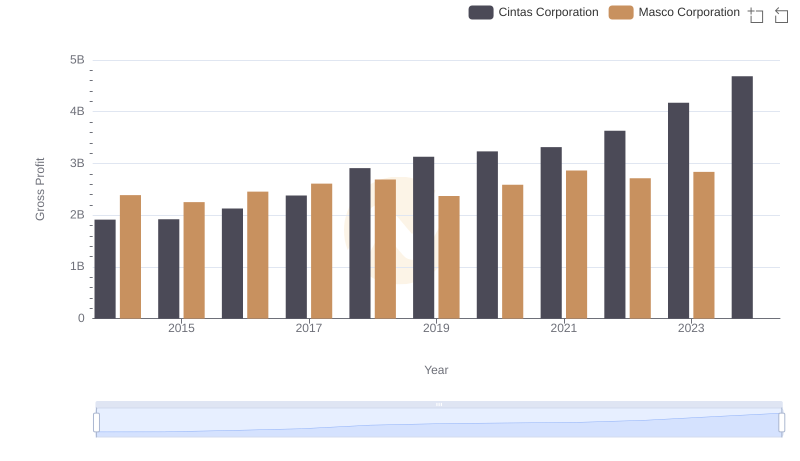
Gross Profit Analysis: Comparing Cintas Corporation and Masco Corporation
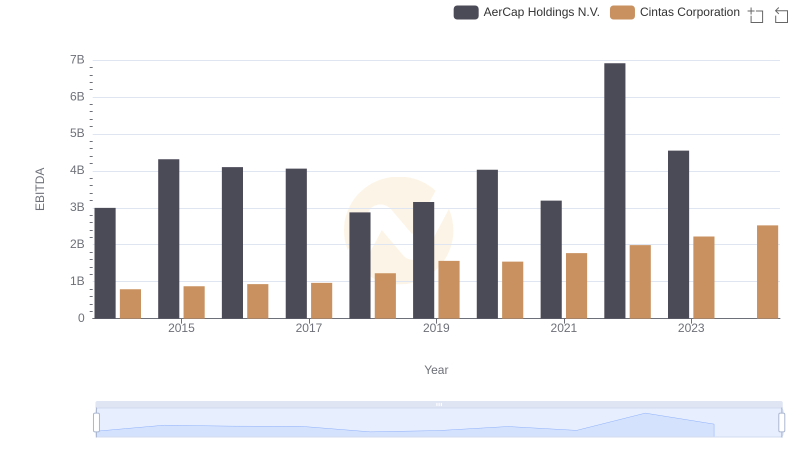
EBITDA Performance Review: Cintas Corporation vs AerCap Holdings N.V.
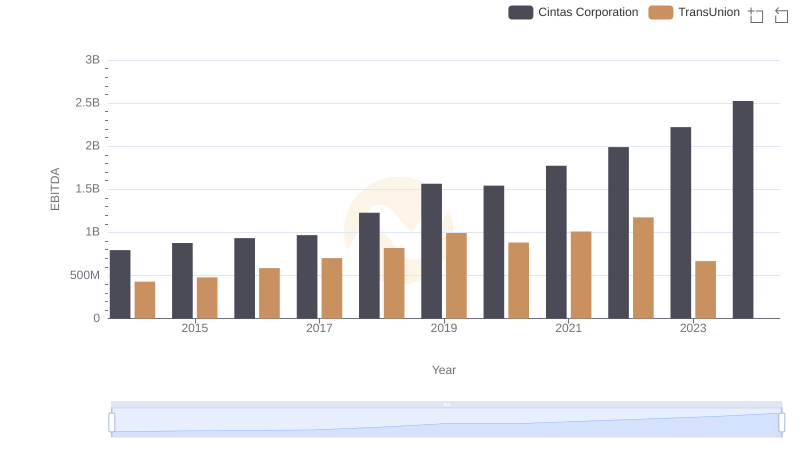
EBITDA Performance Review: Cintas Corporation vs TransUnion
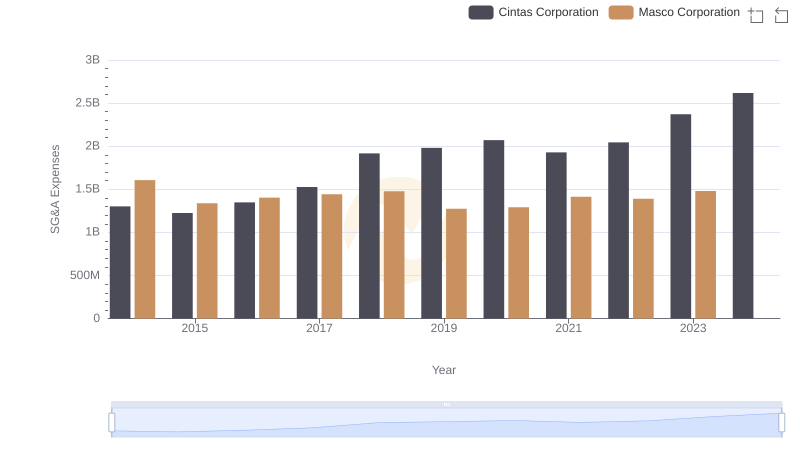
Cintas Corporation vs Masco Corporation: SG&A Expense Trends
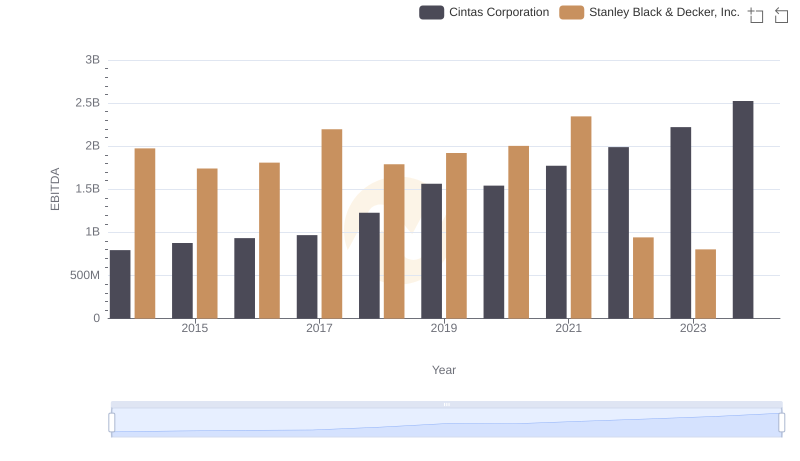
Cintas Corporation vs Stanley Black & Decker, Inc.: In-Depth EBITDA Performance Comparison
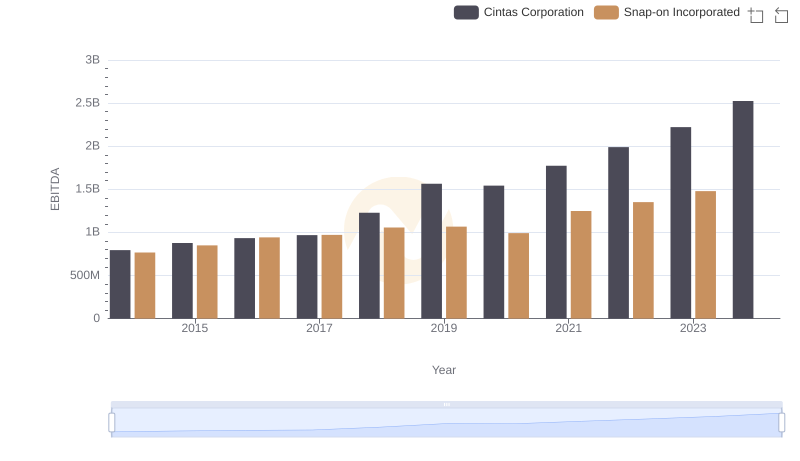
EBITDA Metrics Evaluated: Cintas Corporation vs Snap-on Incorporated
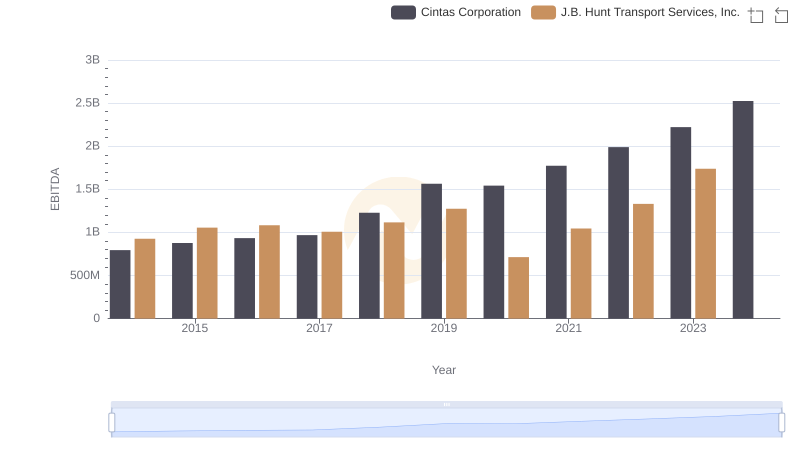
Comparative EBITDA Analysis: Cintas Corporation vs J.B. Hunt Transport Services, Inc.
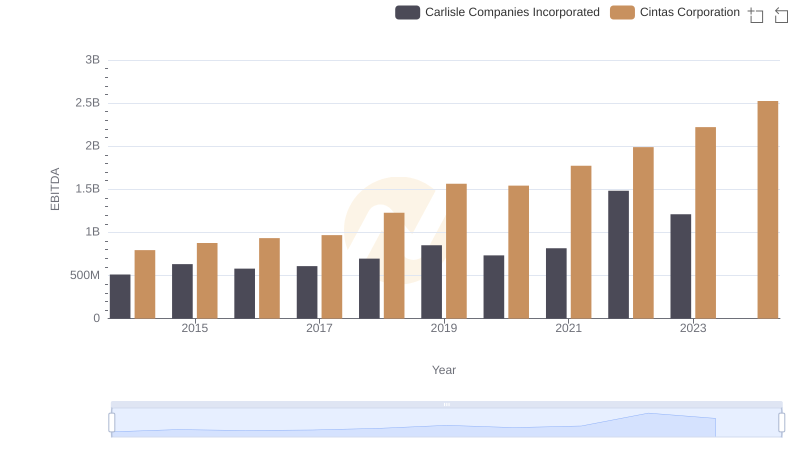
EBITDA Metrics Evaluated: Cintas Corporation vs Carlisle Companies Incorporated
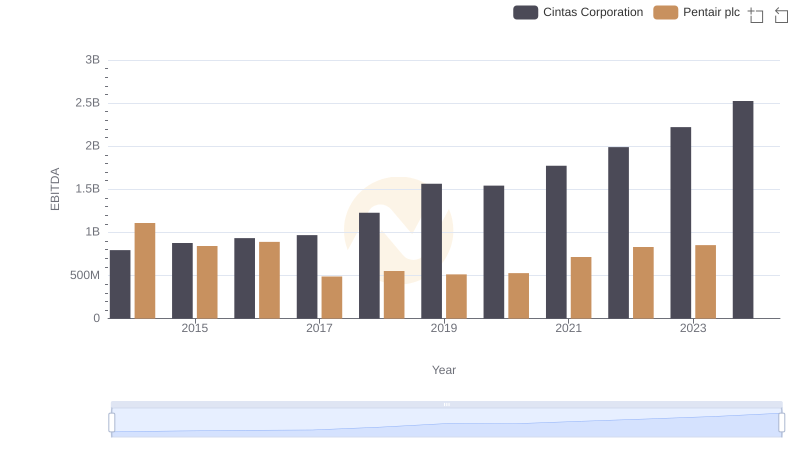
Professional EBITDA Benchmarking: Cintas Corporation vs Pentair plc