| __timestamp | Builders FirstSource, Inc. | Cintas Corporation |
|---|---|---|
| Wednesday, January 1, 2014 | 60008000 | 793811000 |
| Thursday, January 1, 2015 | 148897000 | 877761000 |
| Friday, January 1, 2016 | 346129000 | 933728000 |
| Sunday, January 1, 2017 | 378096000 | 968293000 |
| Monday, January 1, 2018 | 466874000 | 1227852000 |
| Tuesday, January 1, 2019 | 492344000 | 1564228000 |
| Wednesday, January 1, 2020 | 660420000 | 1542737000 |
| Friday, January 1, 2021 | 2934776000 | 1773591000 |
| Saturday, January 1, 2022 | 4267346000 | 1990046000 |
| Sunday, January 1, 2023 | 2734594000 | 2221676000 |
| Monday, January 1, 2024 | 2523857000 |
Cracking the code
In the dynamic landscape of the U.S. stock market, understanding a company's financial health is crucial for investors and analysts alike. One of the key indicators of operational performance is Earnings Before Interest, Taxes, Depreciation, and Amortization (EBITDA). This metric provides a clearer picture of a company's profitability by stripping away non-operational expenses. In this article, we delve into a side-by-side analysis of two prominent players: Cintas Corporation and Builders FirstSource, Inc., focusing on their EBITDA performance from 2014 to 2023.
Cintas Corporation, established in 1968, is a leader in providing corporate identity uniforms and related business services. On the other hand, Builders FirstSource, Inc., founded in 1998, has rapidly ascended to become a major supplier of building materials and manufactured components for residential and commercial construction. Both companies operate in sectors that have shown resilience and growth, particularly in the post-pandemic era, where demand for construction and corporate services surged.
From 2014 to 2023, Cintas Corporation has exhibited a robust growth trajectory in EBITDA, starting from approximately $793 million in 2014 and peaking at nearly $2.22 billion in 2023. This represents a staggering increase of over 180% in just a decade, showcasing Cintas's effective business strategies and market expansion efforts.
In contrast, Builders FirstSource, Inc. has shown an even more dramatic increase in EBITDA, starting at around $60 million in 2014 and soaring to approximately $2.73 billion by 2023. This remarkable growth of over 4,400% highlights the company's aggressive expansion and the booming construction market, particularly in the residential sector.
Analyzing the yearly EBITDA figures reveals interesting trends. For instance, in 2021, Builders FirstSource recorded an EBITDA of approximately $2.93 billion, which was a significant leap from previous years, indicating a strong recovery and growth phase. Cintas also experienced a notable increase in EBITDA during the same period, reaching around $1.77 billion. The growth rates for both companies suggest that while Cintas has maintained steady growth, Builders FirstSource has capitalized on market opportunities more aggressively.
However, it is essential to note that data for 2024 is currently missing for Builders FirstSource, which could potentially impact future analyses and projections. Cintas, meanwhile, has shown consistent growth without any data gaps, reinforcing its position as a stable player in the market.
In conclusion, the comparative analysis of EBITDA between Cintas Corporation and Builders FirstSource, Inc. illustrates contrasting yet compelling narratives of growth and market adaptation. While Cintas has steadily increased its EBITDA, Builders FirstSource has experienced explosive growth, driven by favorable market conditions and strategic initiatives. Investors and stakeholders should keep a close watch on these companies as they navigate the evolving economic landscape and continue to adapt to changing market demands.
Understanding these trends not only aids in making informed investment decisions but also highlights the broader economic factors influencing these industries. As we move forward, the performance of these companies will be crucial indicators of their respective sectors' health and resilience.
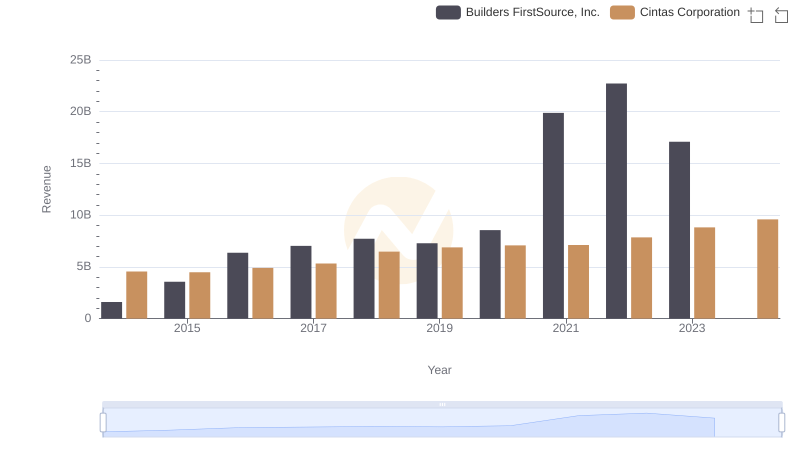
Cintas Corporation vs Builders FirstSource, Inc.: Annual Revenue Growth Compared
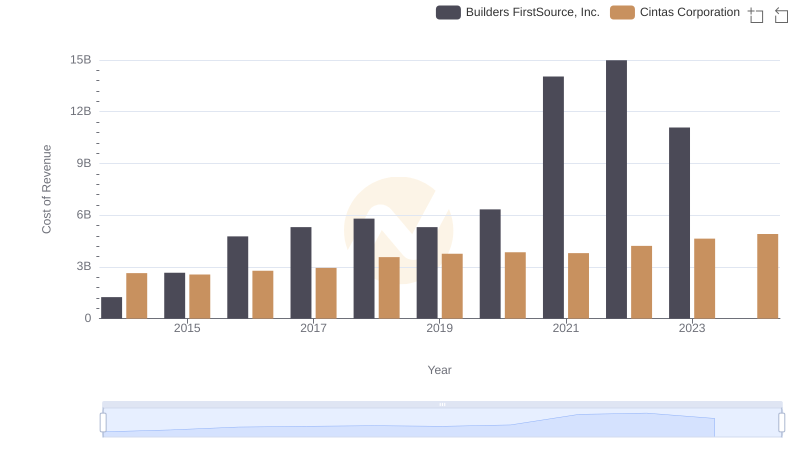
Comparing Cost of Revenue Efficiency: Cintas Corporation vs Builders FirstSource, Inc.
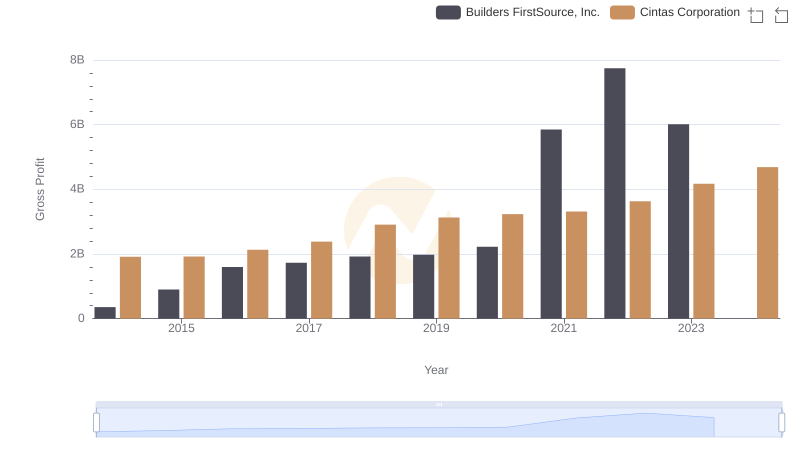
Key Insights on Gross Profit: Cintas Corporation vs Builders FirstSource, Inc.
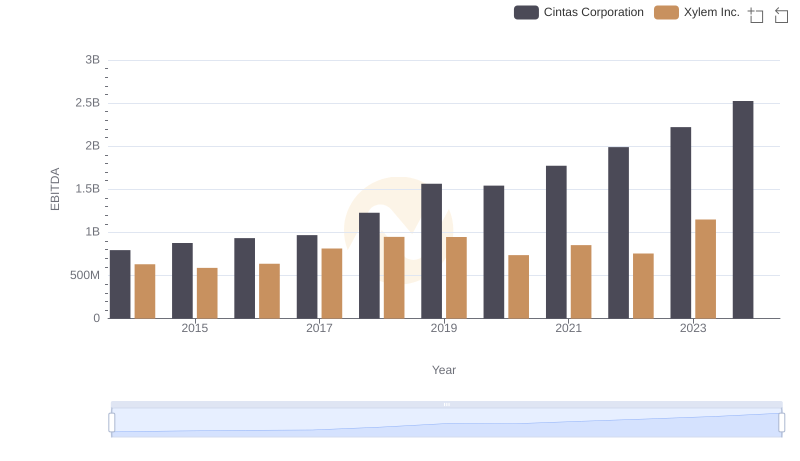
Professional EBITDA Benchmarking: Cintas Corporation vs Xylem Inc.
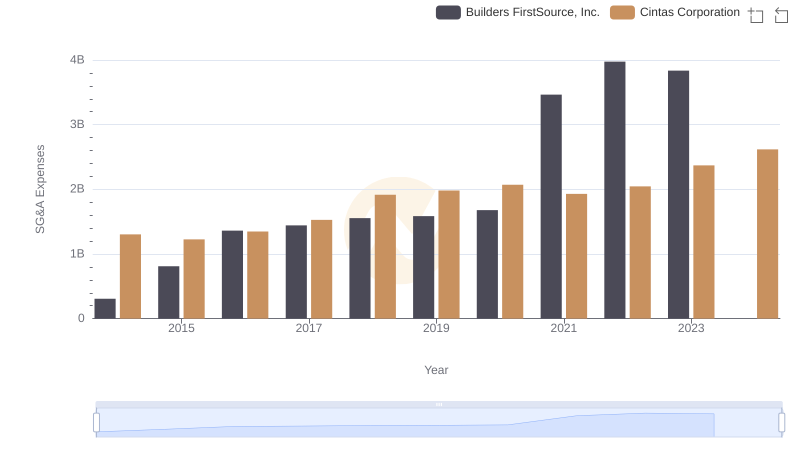
Breaking Down SG&A Expenses: Cintas Corporation vs Builders FirstSource, Inc.
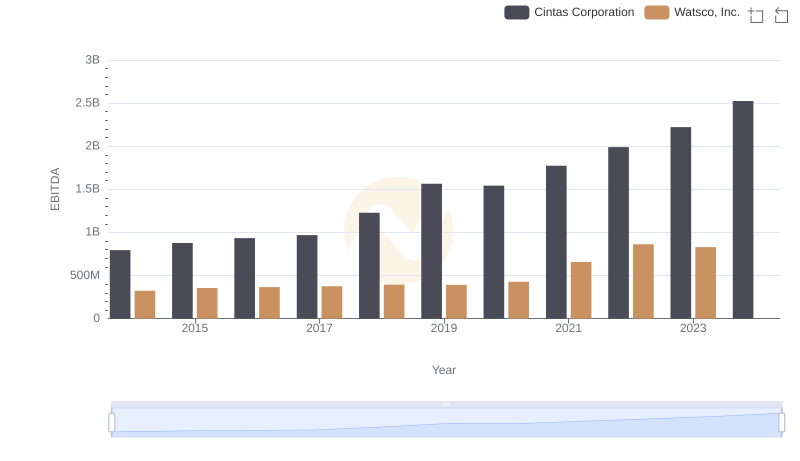
Cintas Corporation and Watsco, Inc.: A Detailed Examination of EBITDA Performance
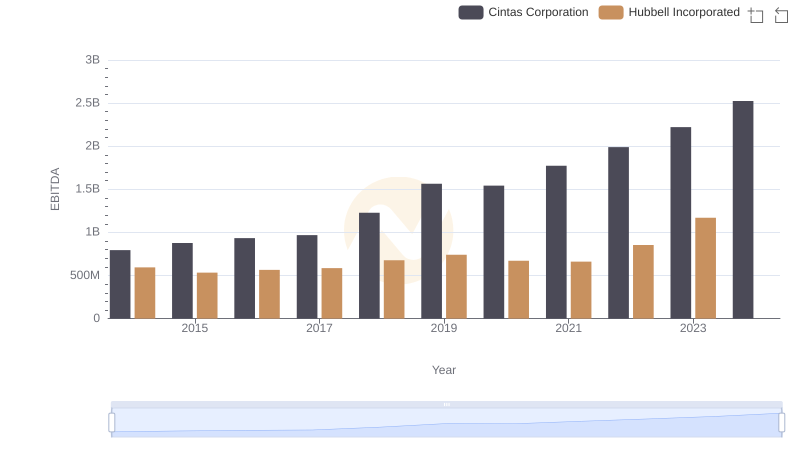
EBITDA Metrics Evaluated: Cintas Corporation vs Hubbell Incorporated
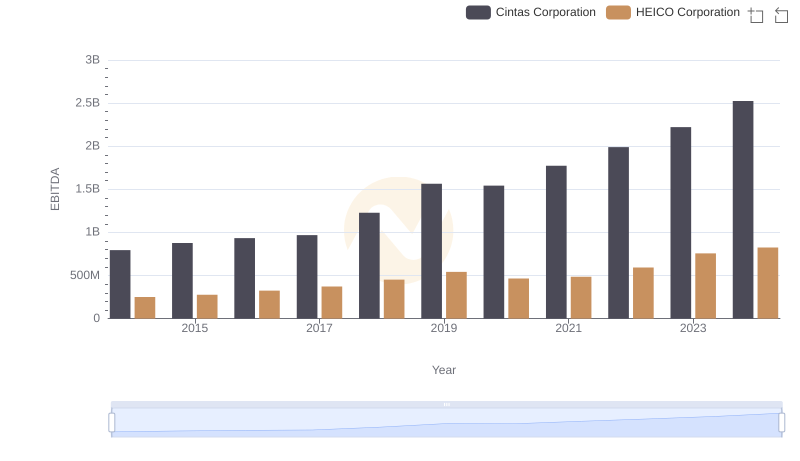
A Professional Review of EBITDA: Cintas Corporation Compared to HEICO Corporation
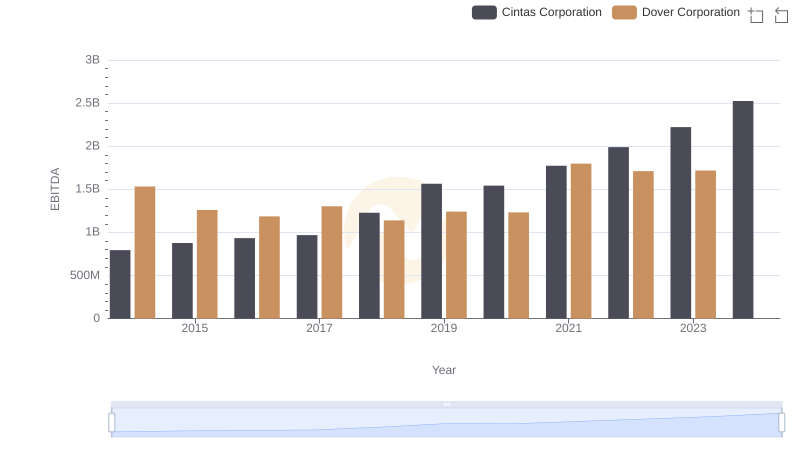
EBITDA Performance Review: Cintas Corporation vs Dover Corporation
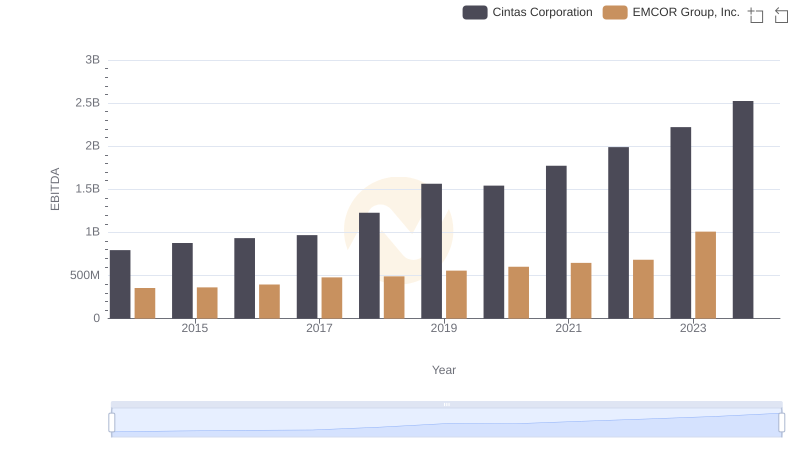
EBITDA Analysis: Evaluating Cintas Corporation Against EMCOR Group, Inc.
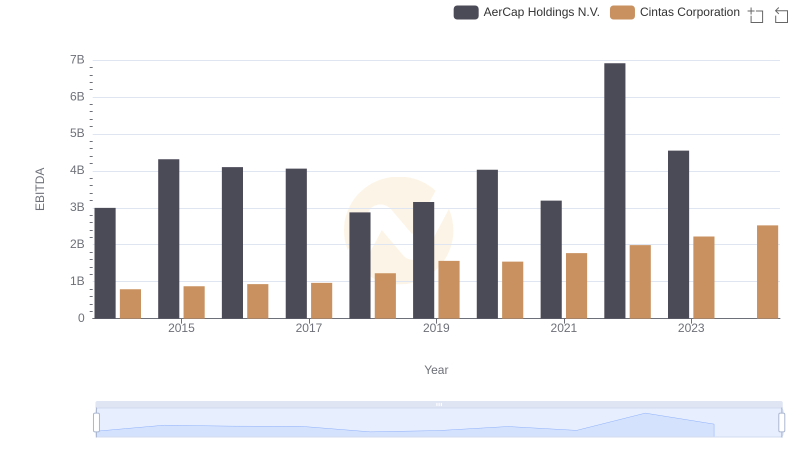
EBITDA Performance Review: Cintas Corporation vs AerCap Holdings N.V.