| __timestamp | Cintas Corporation | Dover Corporation |
|---|---|---|
| Wednesday, January 1, 2014 | 1302752000 | 1758765000 |
| Thursday, January 1, 2015 | 1224930000 | 1647382000 |
| Friday, January 1, 2016 | 1348122000 | 1757523000 |
| Sunday, January 1, 2017 | 1527380000 | 1975932000 |
| Monday, January 1, 2018 | 1916792000 | 1716444000 |
| Tuesday, January 1, 2019 | 1980644000 | 1599098000 |
| Wednesday, January 1, 2020 | 2071052000 | 1541032000 |
| Friday, January 1, 2021 | 1929159000 | 1688278000 |
| Saturday, January 1, 2022 | 2044876000 | 1684226000 |
| Sunday, January 1, 2023 | 2370704000 | 1718290000 |
| Monday, January 1, 2024 | 2617783000 | 1752266000 |
Unleashing insights
In the world of corporate finance, understanding spending patterns is crucial for evaluating a company's operational efficiency. This analysis delves into the Selling, General, and Administrative (SG&A) expenses of two industry giants: Cintas Corporation and Dover Corporation, from 2014 to 2023.
Cintas Corporation has shown a remarkable upward trend in SG&A expenses, with a 100% increase over the decade. Starting at approximately $1.3 billion in 2014, their spending surged to over $2.6 billion by 2023. This consistent rise reflects Cintas's strategic investments in growth and expansion.
In contrast, Dover Corporation's SG&A expenses have remained relatively stable, fluctuating around $1.7 billion. This stability suggests a focus on maintaining operational efficiency and cost control.
The data for 2024 is incomplete, highlighting the need for ongoing analysis to capture future trends.
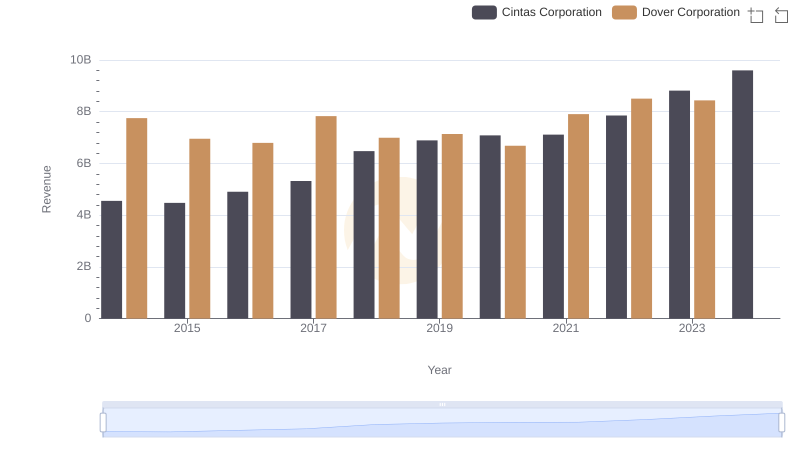
Revenue Insights: Cintas Corporation and Dover Corporation Performance Compared
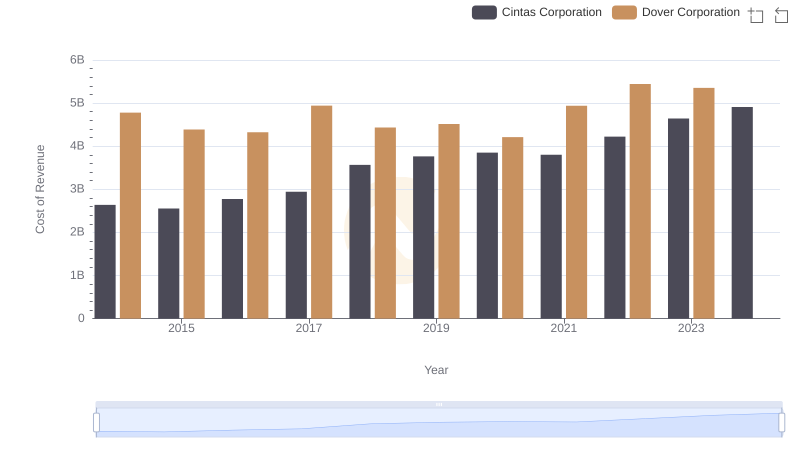
Cost of Revenue Trends: Cintas Corporation vs Dover Corporation
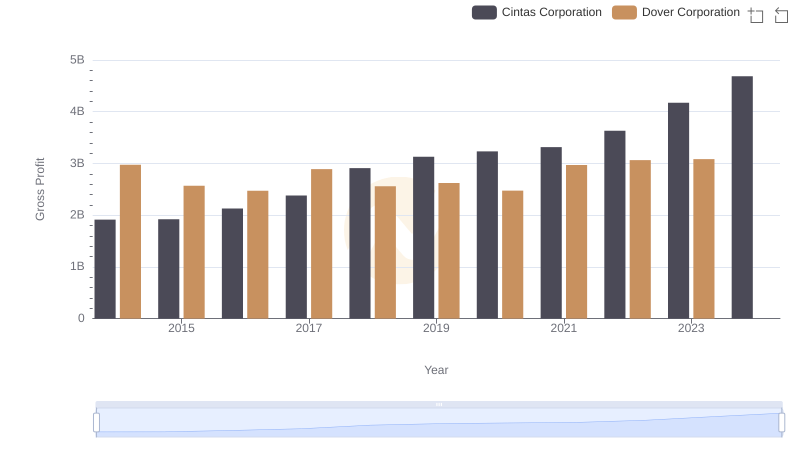
Gross Profit Analysis: Comparing Cintas Corporation and Dover Corporation
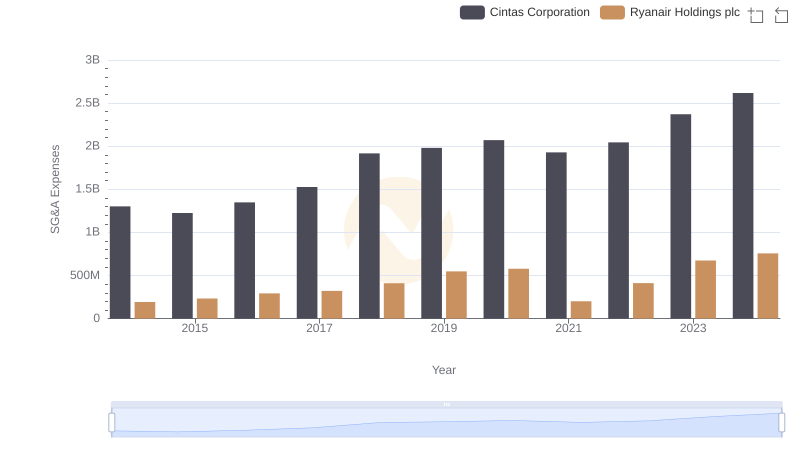
Comparing SG&A Expenses: Cintas Corporation vs Ryanair Holdings plc Trends and Insights
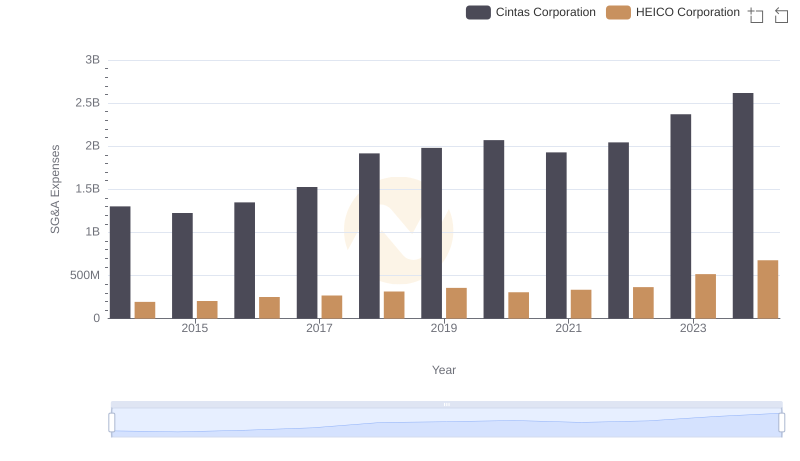
Cintas Corporation vs HEICO Corporation: SG&A Expense Trends
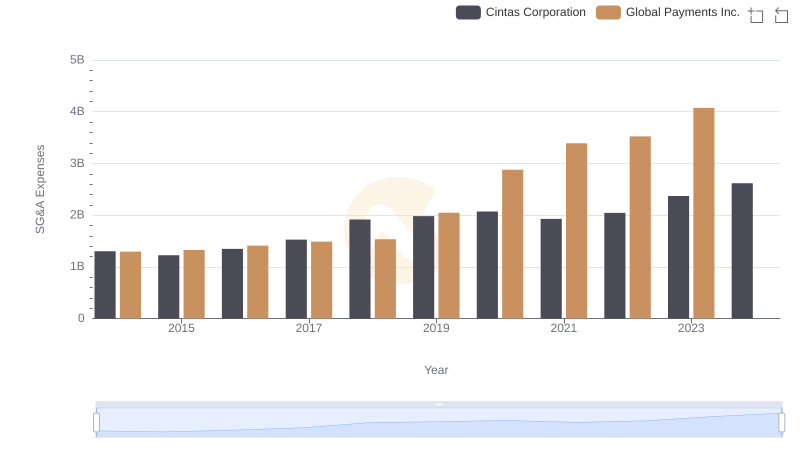
Cintas Corporation and Global Payments Inc.: SG&A Spending Patterns Compared
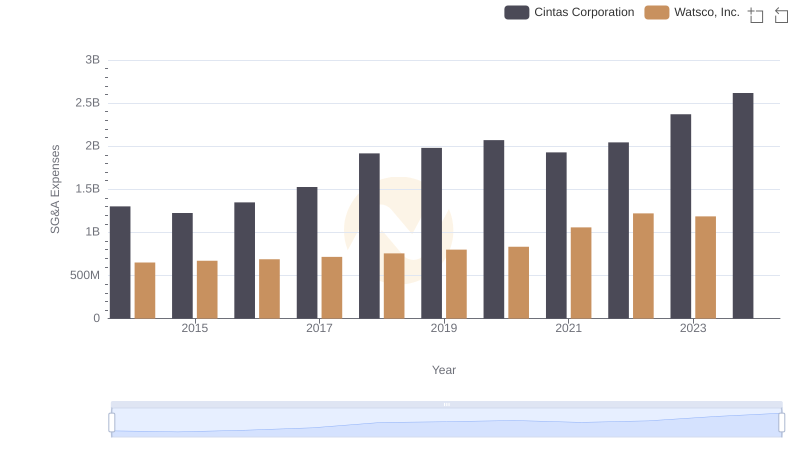
Cintas Corporation vs Watsco, Inc.: SG&A Expense Trends
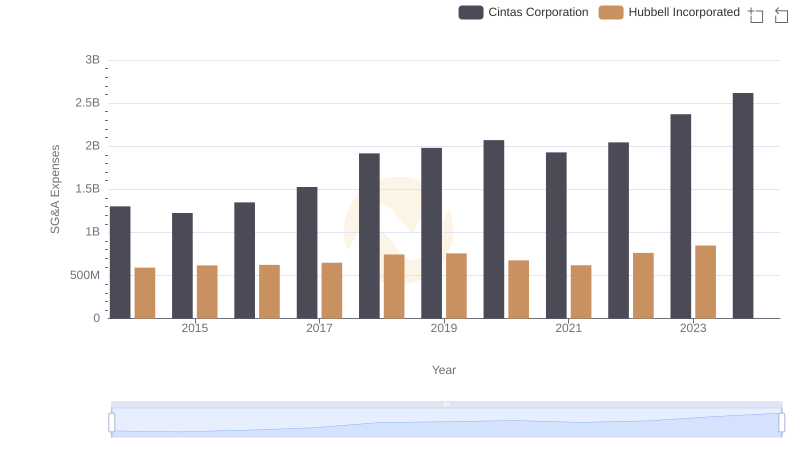
SG&A Efficiency Analysis: Comparing Cintas Corporation and Hubbell Incorporated
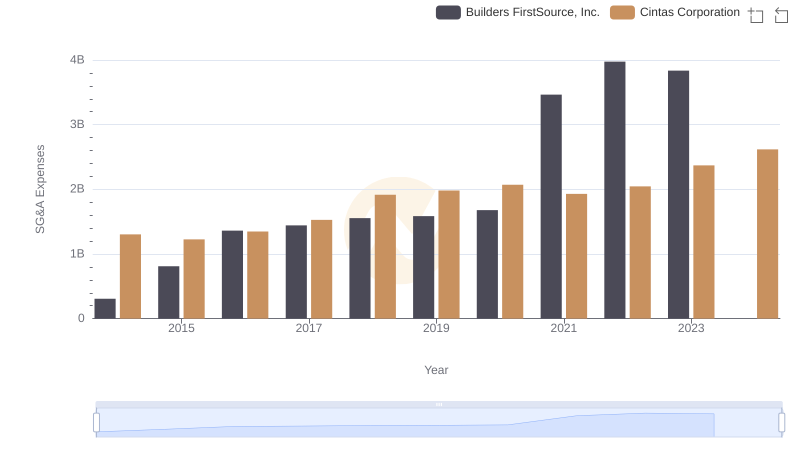
Breaking Down SG&A Expenses: Cintas Corporation vs Builders FirstSource, Inc.
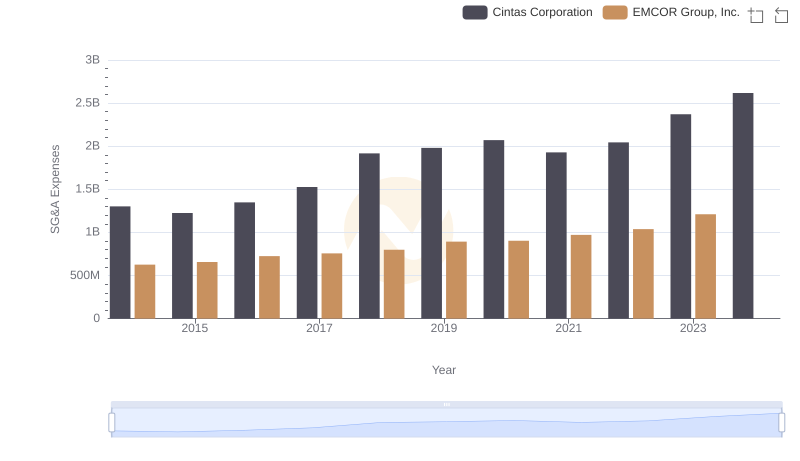
Comparing SG&A Expenses: Cintas Corporation vs EMCOR Group, Inc. Trends and Insights
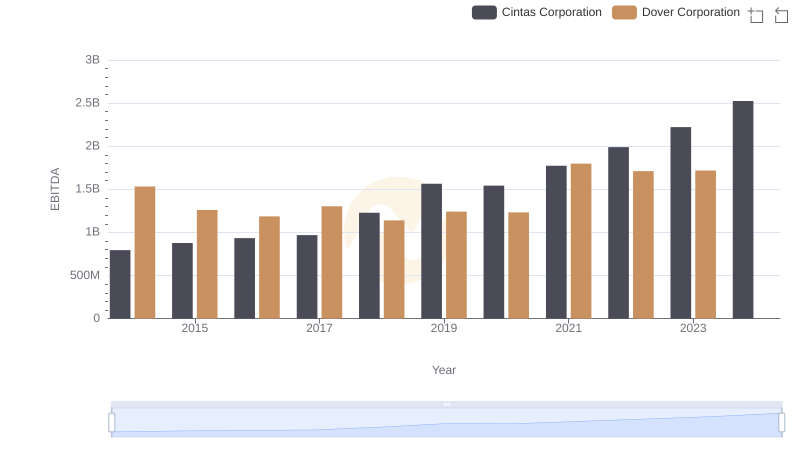
EBITDA Performance Review: Cintas Corporation vs Dover Corporation