| __timestamp | Cintas Corporation | Dover Corporation |
|---|---|---|
| Wednesday, January 1, 2014 | 1914386000 | 2974249000 |
| Thursday, January 1, 2015 | 1921337000 | 2568144000 |
| Friday, January 1, 2016 | 2129870000 | 2471969000 |
| Sunday, January 1, 2017 | 2380295000 | 2890377000 |
| Monday, January 1, 2018 | 2908523000 | 2559556000 |
| Tuesday, January 1, 2019 | 3128588000 | 2620938000 |
| Wednesday, January 1, 2020 | 3233748000 | 2474019000 |
| Friday, January 1, 2021 | 3314651000 | 2969786000 |
| Saturday, January 1, 2022 | 3632246000 | 3063556000 |
| Sunday, January 1, 2023 | 4173368000 | 3084633000 |
| Monday, January 1, 2024 | 4686416000 | 2958621000 |
Data in motion
In the competitive landscape of industrial services, Cintas Corporation and Dover Corporation have showcased intriguing financial trajectories over the past decade. Since 2014, Cintas has demonstrated a robust growth in gross profit, surging by approximately 145% by 2023. This impressive rise reflects Cintas' strategic expansions and operational efficiencies. In contrast, Dover Corporation's gross profit has seen a more modest increase of about 4% over the same period, indicating a steadier growth path.
The data for 2024 is incomplete, with Cintas showing continued growth, while Dover's figures remain unreported. This analysis underscores the dynamic nature of the industrial sector and the varying strategies of its key players.
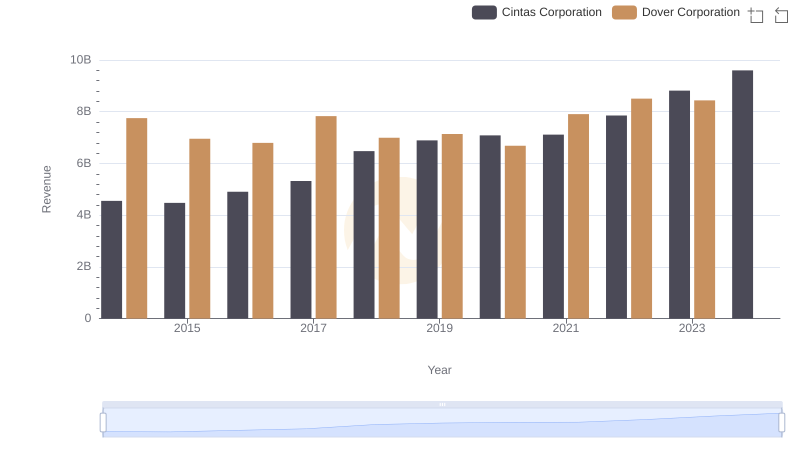
Revenue Insights: Cintas Corporation and Dover Corporation Performance Compared
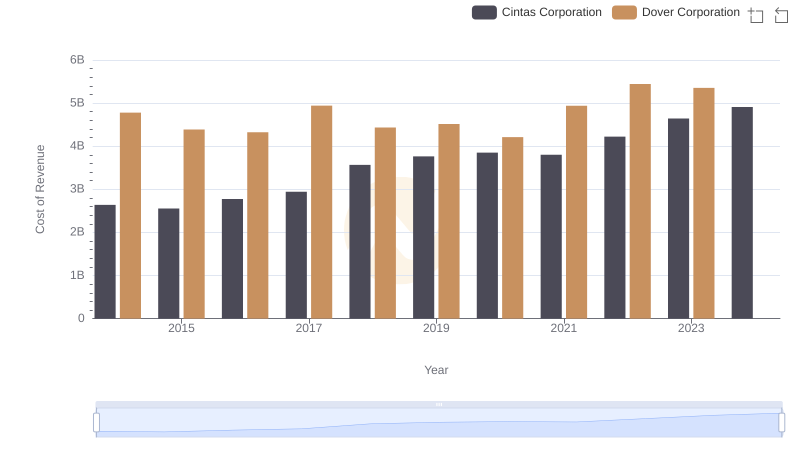
Cost of Revenue Trends: Cintas Corporation vs Dover Corporation
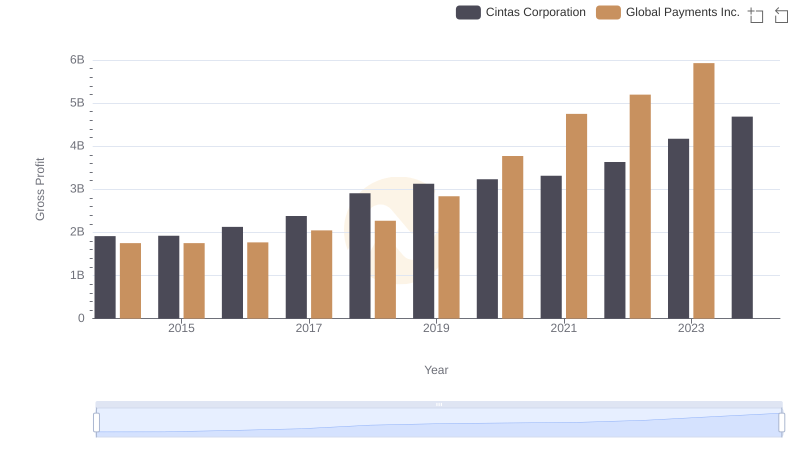
Who Generates Higher Gross Profit? Cintas Corporation or Global Payments Inc.
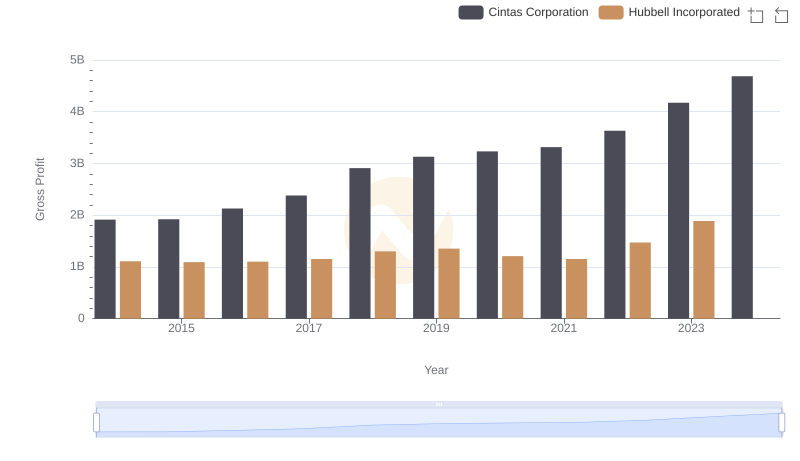
Gross Profit Comparison: Cintas Corporation and Hubbell Incorporated Trends
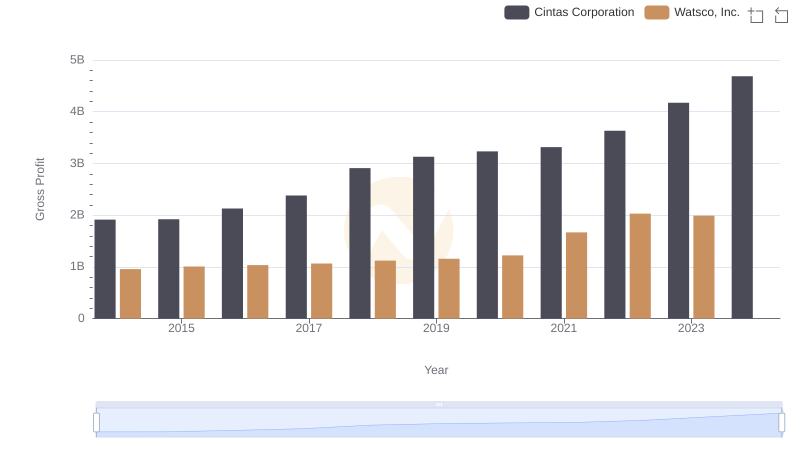
Cintas Corporation and Watsco, Inc.: A Detailed Gross Profit Analysis
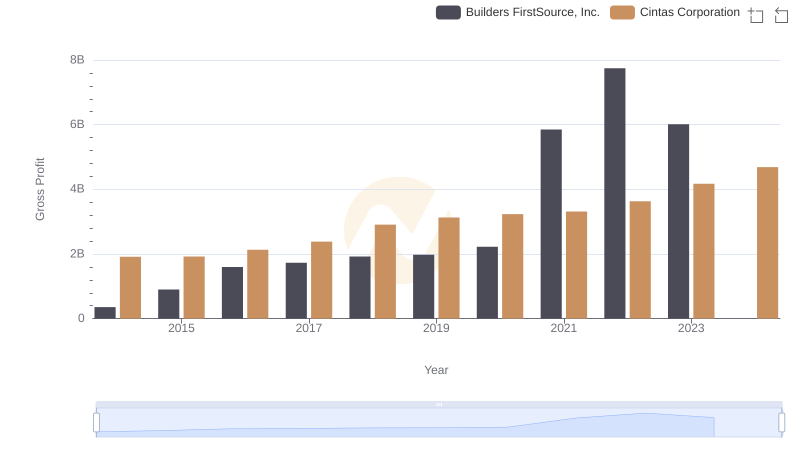
Key Insights on Gross Profit: Cintas Corporation vs Builders FirstSource, Inc.
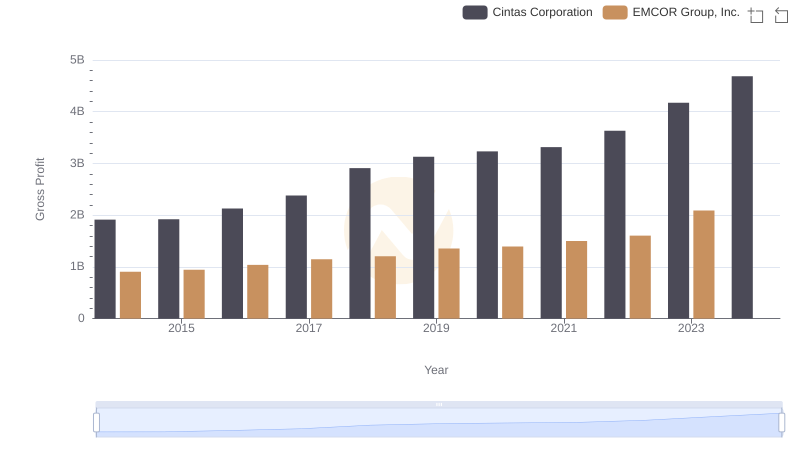
Gross Profit Trends Compared: Cintas Corporation vs EMCOR Group, Inc.
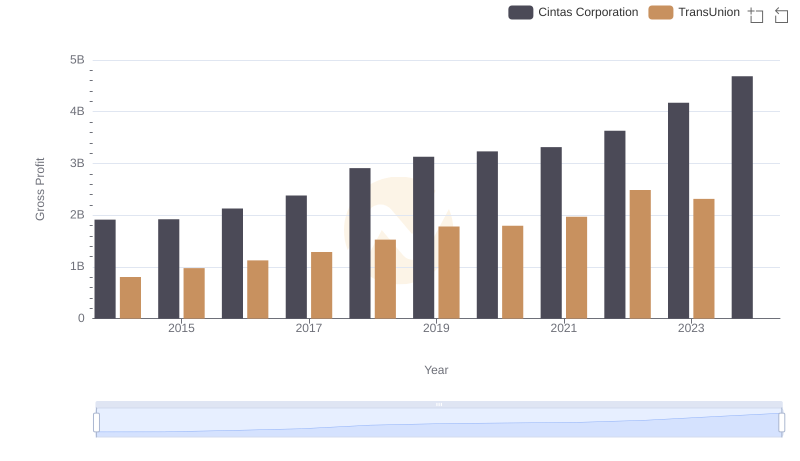
Gross Profit Trends Compared: Cintas Corporation vs TransUnion
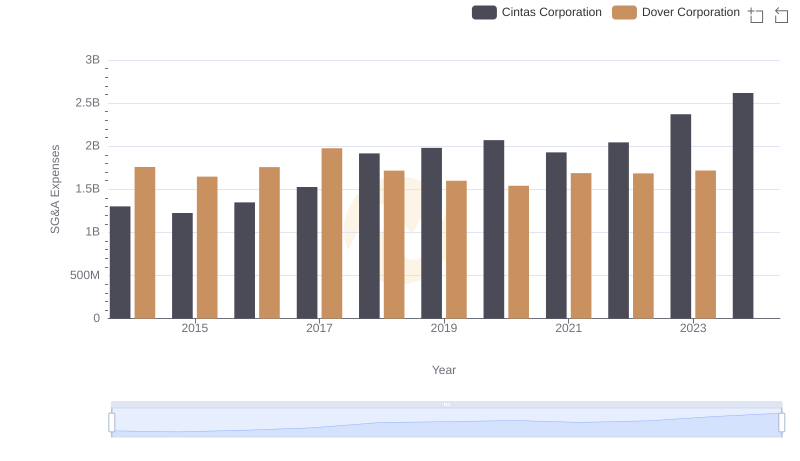
Cintas Corporation and Dover Corporation: SG&A Spending Patterns Compared

Who Generates Higher Gross Profit? Cintas Corporation or AerCap Holdings N.V.
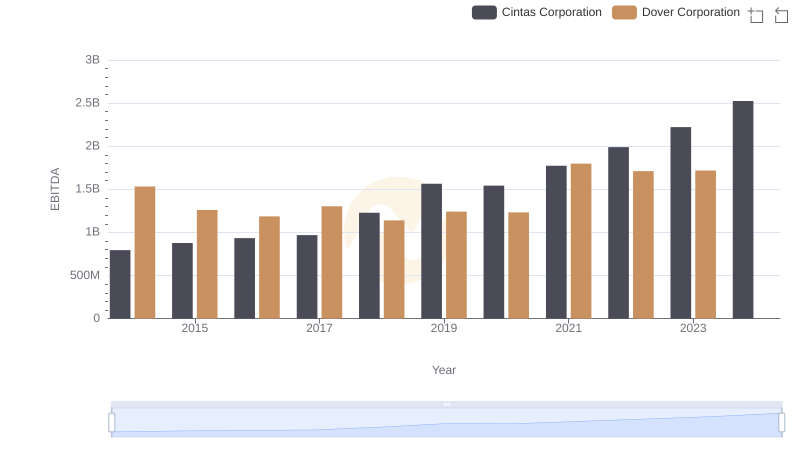
EBITDA Performance Review: Cintas Corporation vs Dover Corporation