| __timestamp | Cintas Corporation | Watsco, Inc. |
|---|---|---|
| Wednesday, January 1, 2014 | 793811000 | 323674000 |
| Thursday, January 1, 2015 | 877761000 | 355865000 |
| Friday, January 1, 2016 | 933728000 | 365698000 |
| Sunday, January 1, 2017 | 968293000 | 375907000 |
| Monday, January 1, 2018 | 1227852000 | 394177000 |
| Tuesday, January 1, 2019 | 1564228000 | 391396000 |
| Wednesday, January 1, 2020 | 1542737000 | 426942000 |
| Friday, January 1, 2021 | 1773591000 | 656655000 |
| Saturday, January 1, 2022 | 1990046000 | 863261000 |
| Sunday, January 1, 2023 | 2221676000 | 829900000 |
| Monday, January 1, 2024 | 2523857000 | 781775000 |
Unleashing insights
In the ever-evolving landscape of corporate finance, EBITDA serves as a crucial indicator of a company's operational efficiency. From 2014 to 2023, Cintas Corporation has demonstrated a remarkable growth trajectory, with its EBITDA increasing by approximately 218%. This growth underscores Cintas's strategic prowess in optimizing its operational processes. In contrast, Watsco, Inc. has also shown a commendable increase of around 156% in EBITDA over the same period, reflecting its resilience and adaptability in the HVAC distribution sector.
While Cintas's EBITDA reached its peak in 2023, Watsco's data for 2024 remains elusive, leaving room for speculation about its future performance. This analysis not only highlights the financial health of these industry leaders but also offers insights into their strategic maneuvers in a competitive market. As we look to the future, the question remains: how will these companies continue to innovate and grow?
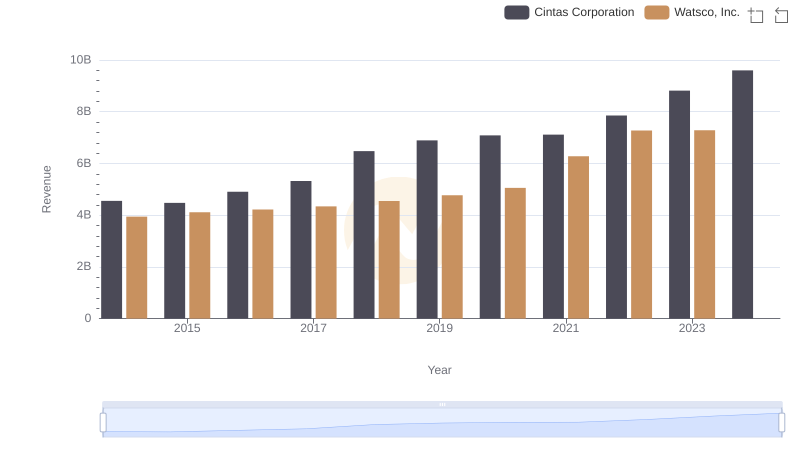
Cintas Corporation vs Watsco, Inc.: Examining Key Revenue Metrics
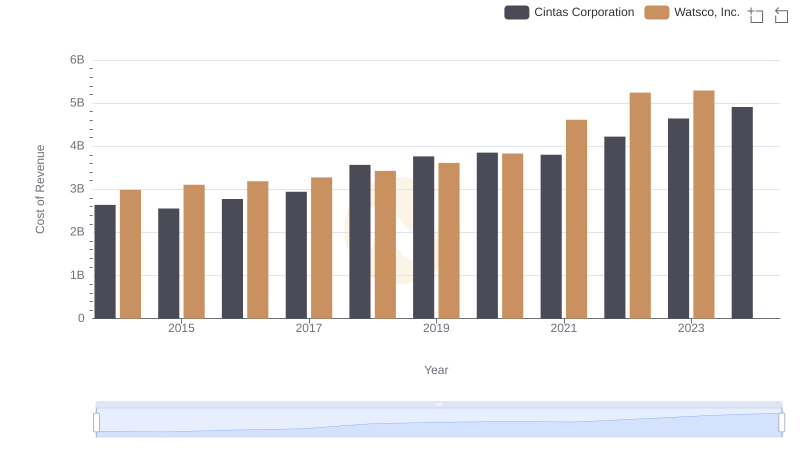
Cost of Revenue: Key Insights for Cintas Corporation and Watsco, Inc.
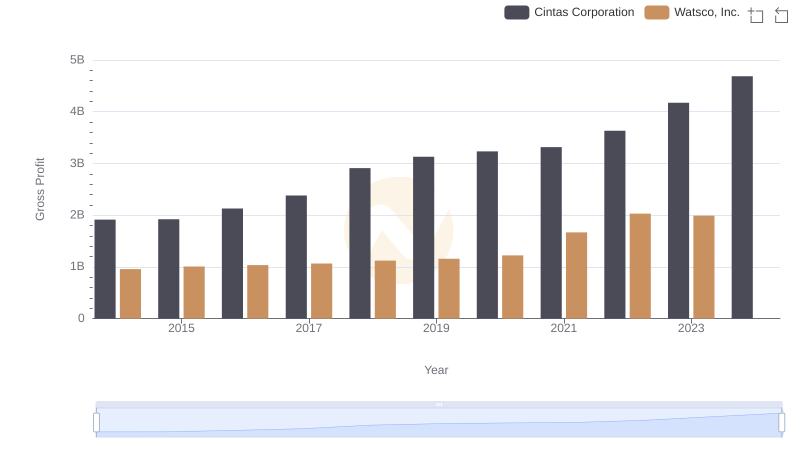
Cintas Corporation and Watsco, Inc.: A Detailed Gross Profit Analysis
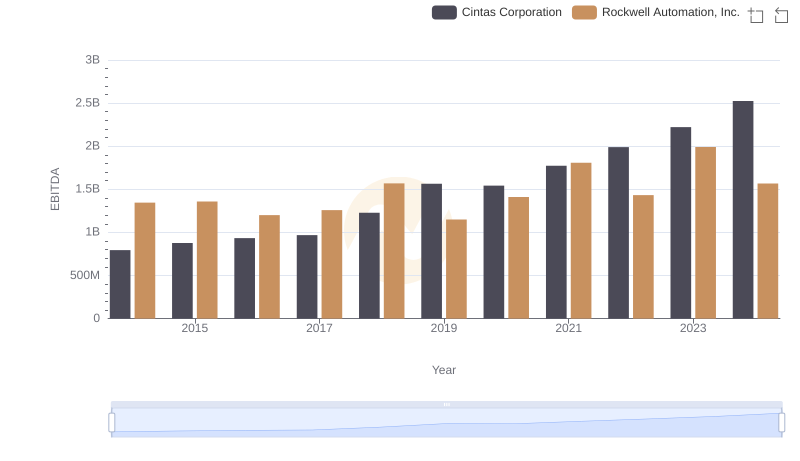
A Side-by-Side Analysis of EBITDA: Cintas Corporation and Rockwell Automation, Inc.
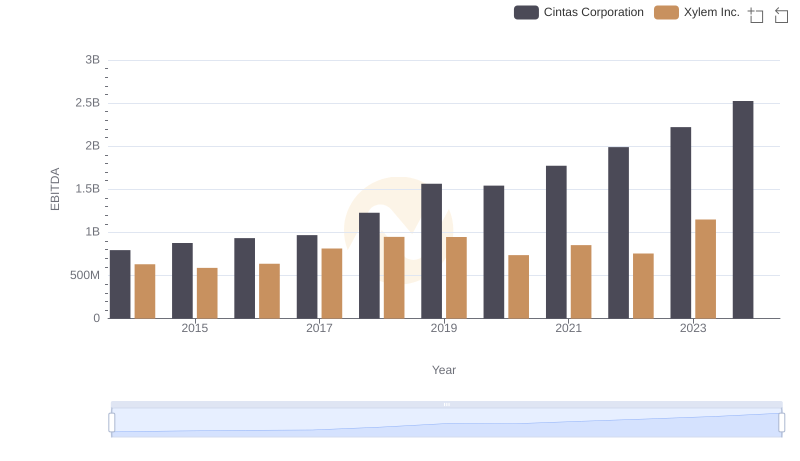
Professional EBITDA Benchmarking: Cintas Corporation vs Xylem Inc.
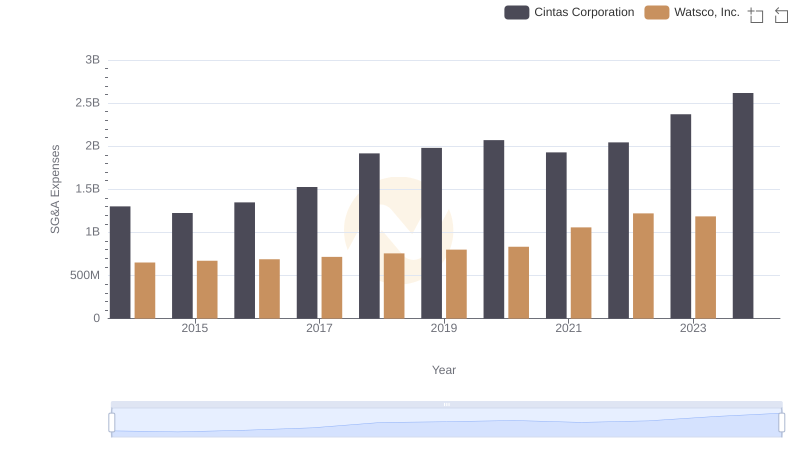
Cintas Corporation vs Watsco, Inc.: SG&A Expense Trends
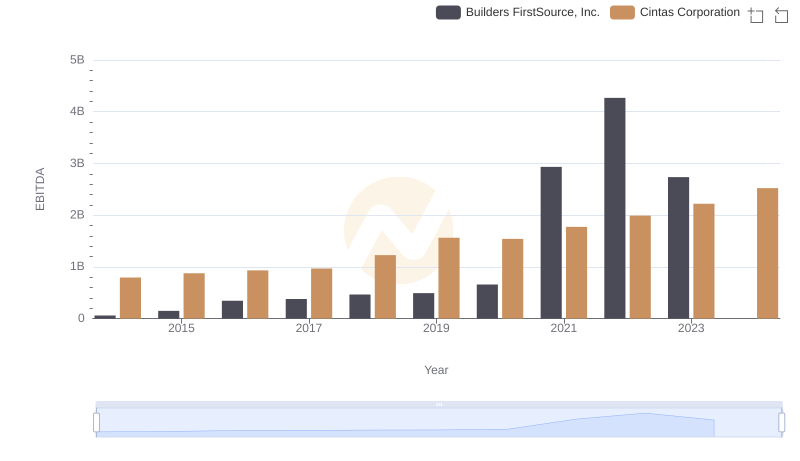
A Side-by-Side Analysis of EBITDA: Cintas Corporation and Builders FirstSource, Inc.
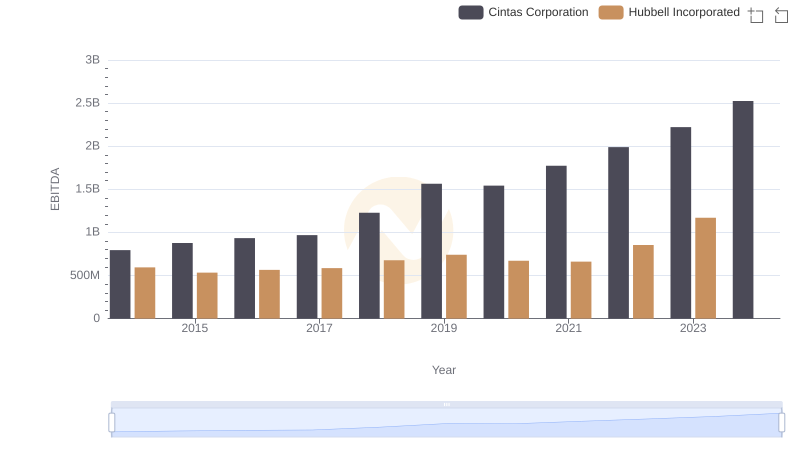
EBITDA Metrics Evaluated: Cintas Corporation vs Hubbell Incorporated
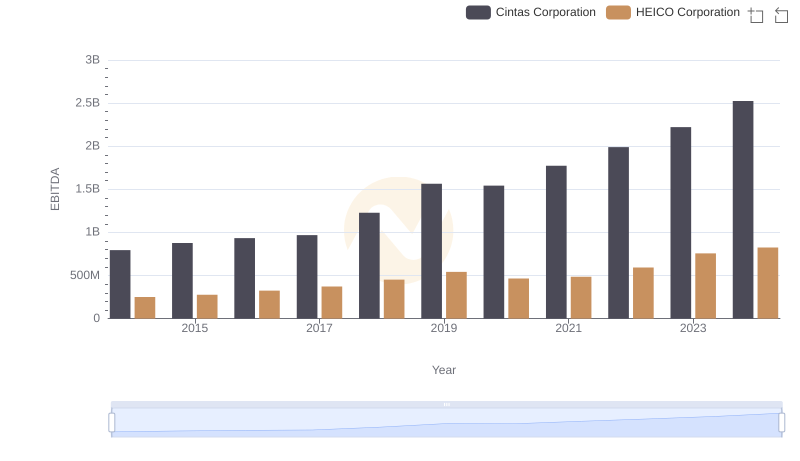
A Professional Review of EBITDA: Cintas Corporation Compared to HEICO Corporation
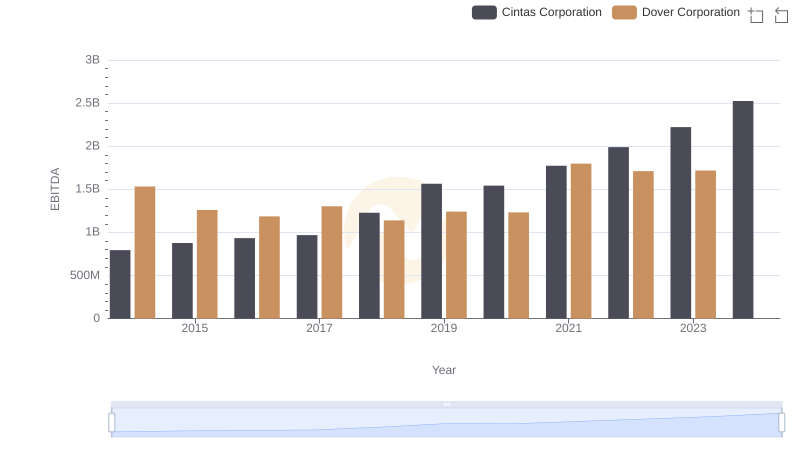
EBITDA Performance Review: Cintas Corporation vs Dover Corporation
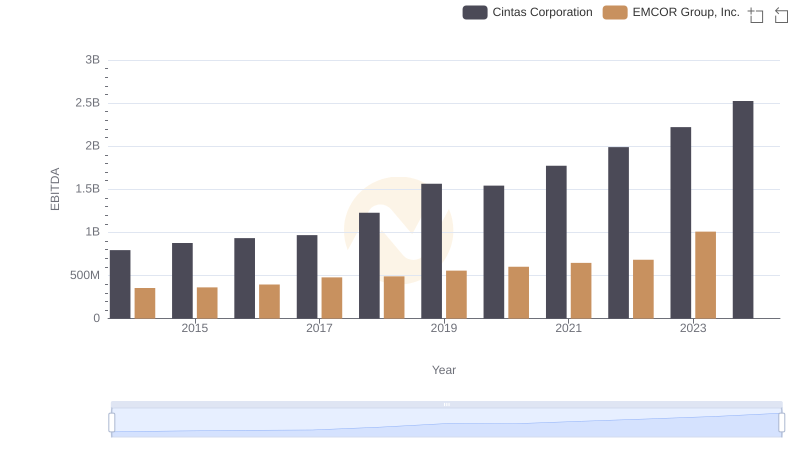
EBITDA Analysis: Evaluating Cintas Corporation Against EMCOR Group, Inc.