| __timestamp | Cintas Corporation | Dover Corporation |
|---|---|---|
| Wednesday, January 1, 2014 | 2637426000 | 4778479000 |
| Thursday, January 1, 2015 | 2555549000 | 4388167000 |
| Friday, January 1, 2016 | 2775588000 | 4322373000 |
| Sunday, January 1, 2017 | 2943086000 | 4940059000 |
| Monday, January 1, 2018 | 3568109000 | 4432562000 |
| Tuesday, January 1, 2019 | 3763715000 | 4515459000 |
| Wednesday, January 1, 2020 | 3851372000 | 4209741000 |
| Friday, January 1, 2021 | 3801689000 | 4937295000 |
| Saturday, January 1, 2022 | 4222213000 | 5444532000 |
| Sunday, January 1, 2023 | 4642401000 | 5353501000 |
| Monday, January 1, 2024 | 4910199000 | 4787288000 |
Unveiling the hidden dimensions of data
In the ever-evolving landscape of corporate finance, understanding cost trends is crucial. From 2014 to 2023, Cintas Corporation and Dover Corporation have shown distinct trajectories in their cost of revenue. Cintas, a leader in uniform rental services, saw a steady increase, with costs rising by approximately 86% over the decade. This growth reflects their expanding market presence and operational scale. In contrast, Dover Corporation, a diversified global manufacturer, experienced a more fluctuating pattern, peaking in 2022 with a 27% increase from 2014, before a slight dip in 2023. Notably, data for Dover in 2024 is missing, leaving room for speculation on future trends. These insights highlight the dynamic nature of cost management in different industries, offering a window into strategic financial planning.
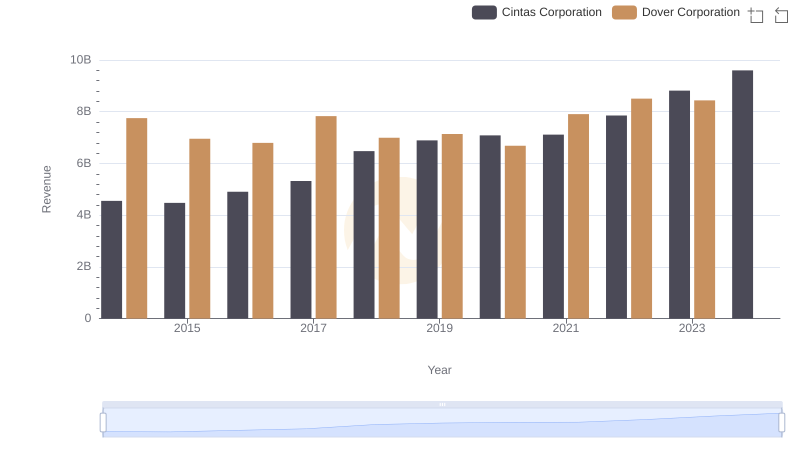
Revenue Insights: Cintas Corporation and Dover Corporation Performance Compared
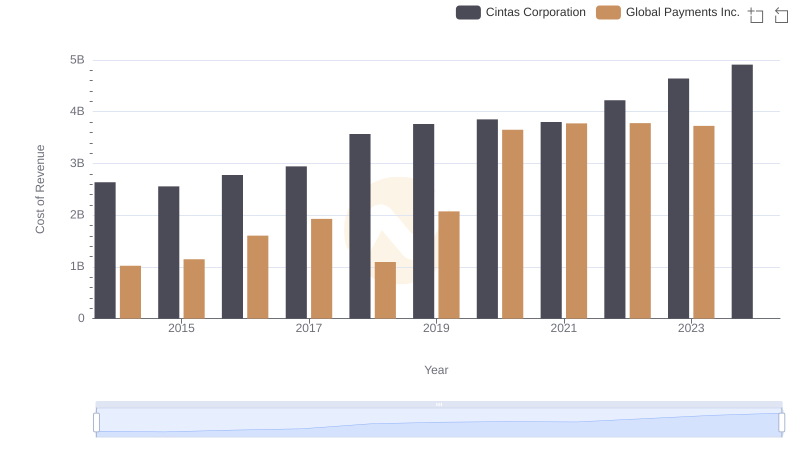
Comparing Cost of Revenue Efficiency: Cintas Corporation vs Global Payments Inc.
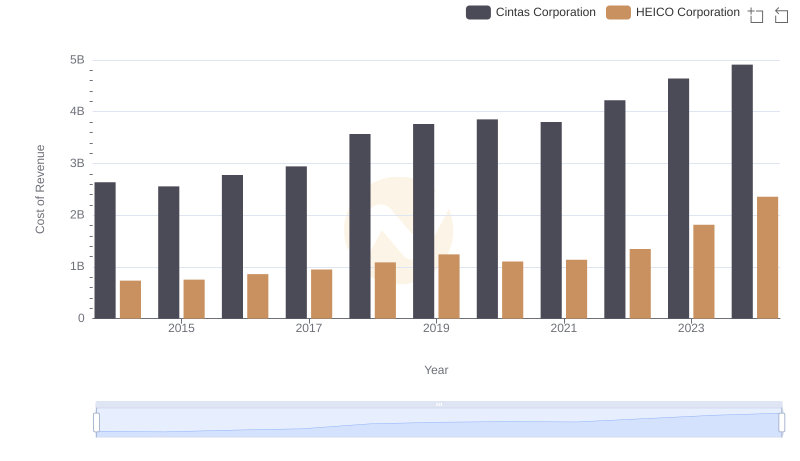
Cintas Corporation vs HEICO Corporation: Efficiency in Cost of Revenue Explored
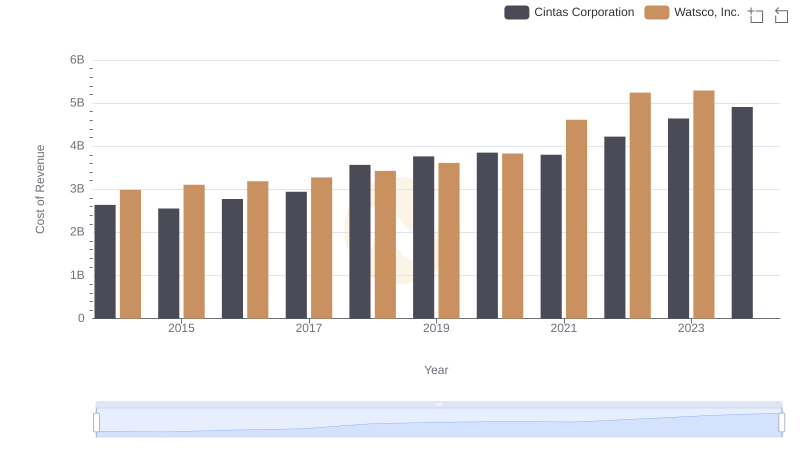
Cost of Revenue: Key Insights for Cintas Corporation and Watsco, Inc.
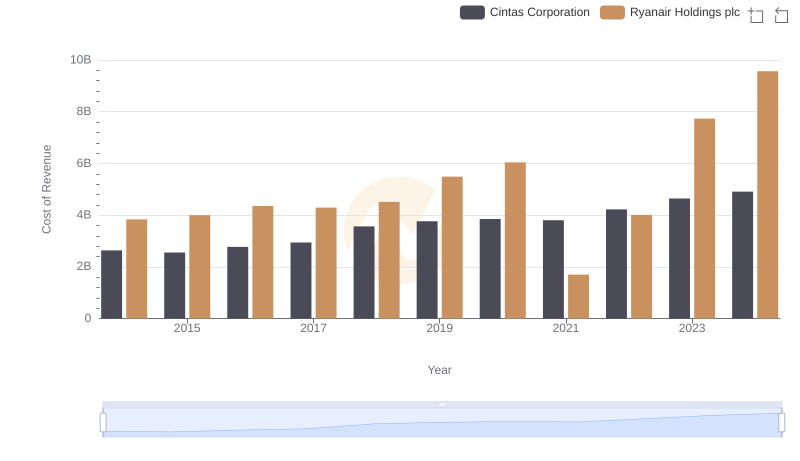
Cost Insights: Breaking Down Cintas Corporation and Ryanair Holdings plc's Expenses
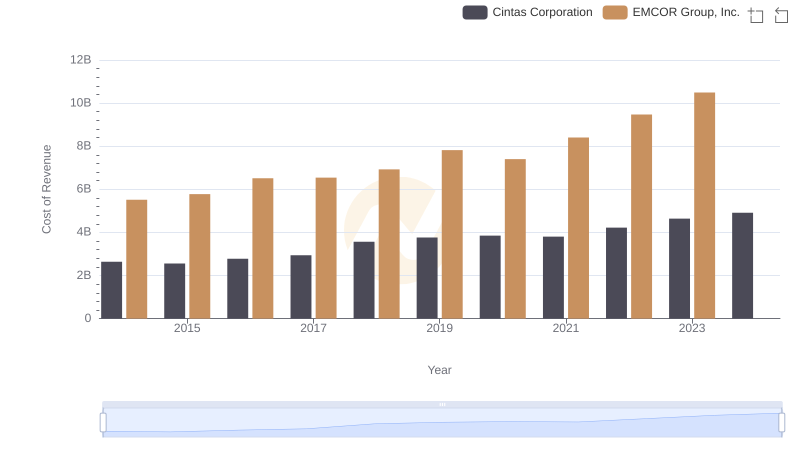
Comparing Cost of Revenue Efficiency: Cintas Corporation vs EMCOR Group, Inc.
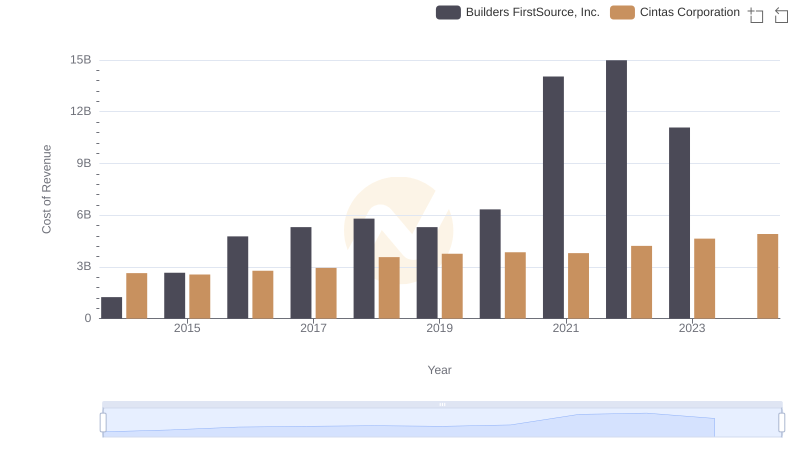
Comparing Cost of Revenue Efficiency: Cintas Corporation vs Builders FirstSource, Inc.
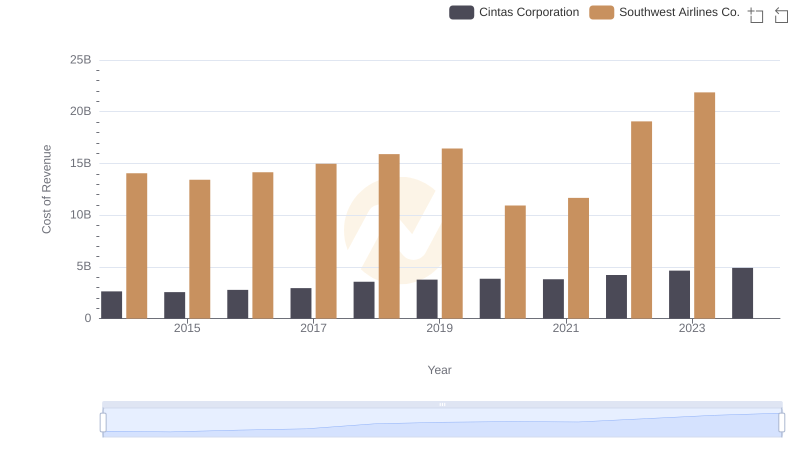
Comparing Cost of Revenue Efficiency: Cintas Corporation vs Southwest Airlines Co.
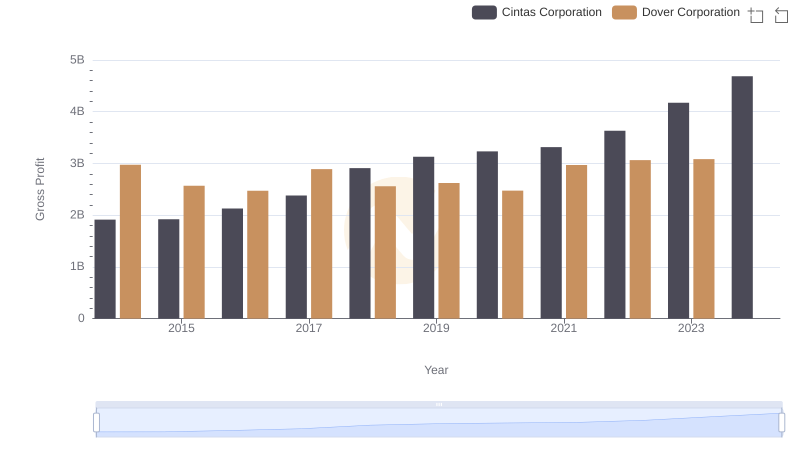
Gross Profit Analysis: Comparing Cintas Corporation and Dover Corporation
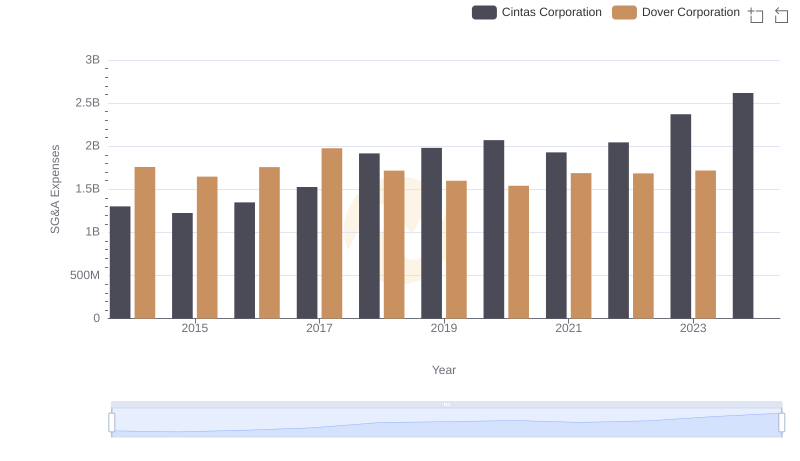
Cintas Corporation and Dover Corporation: SG&A Spending Patterns Compared
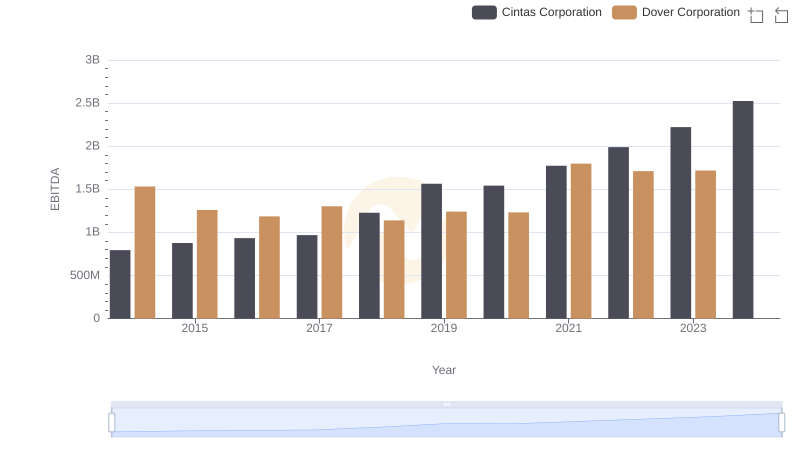
EBITDA Performance Review: Cintas Corporation vs Dover Corporation