| __timestamp | Cintas Corporation | Dover Corporation |
|---|---|---|
| Wednesday, January 1, 2014 | 4551812000 | 7752728000 |
| Thursday, January 1, 2015 | 4476886000 | 6956311000 |
| Friday, January 1, 2016 | 4905458000 | 6794342000 |
| Sunday, January 1, 2017 | 5323381000 | 7830436000 |
| Monday, January 1, 2018 | 6476632000 | 6992118000 |
| Tuesday, January 1, 2019 | 6892303000 | 7136397000 |
| Wednesday, January 1, 2020 | 7085120000 | 6683760000 |
| Friday, January 1, 2021 | 7116340000 | 7907081000 |
| Saturday, January 1, 2022 | 7854459000 | 8508088000 |
| Sunday, January 1, 2023 | 8815769000 | 8438134000 |
| Monday, January 1, 2024 | 9596615000 | 7745909000 |
Infusing magic into the data realm
In the competitive landscape of industrial services, Cintas Corporation and Dover Corporation have showcased intriguing revenue trajectories over the past decade. Since 2014, Cintas has demonstrated a robust growth pattern, with its revenue surging by approximately 111% by 2024. This impressive growth reflects Cintas's strategic expansions and market adaptability. In contrast, Dover Corporation, while maintaining a steady revenue stream, experienced a more modest increase of around 9% from 2014 to 2023. Notably, Dover's revenue peaked in 2022, marking a significant milestone before a slight dip in 2023. The data for 2024 is incomplete for Dover, highlighting a gap in the current analysis. This comparison underscores the dynamic nature of the industrial sector, where strategic decisions and market conditions play pivotal roles in shaping financial outcomes.
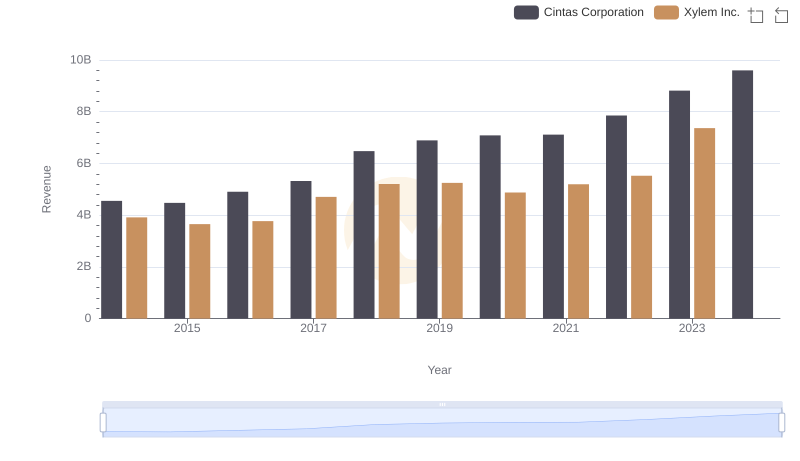
Breaking Down Revenue Trends: Cintas Corporation vs Xylem Inc.
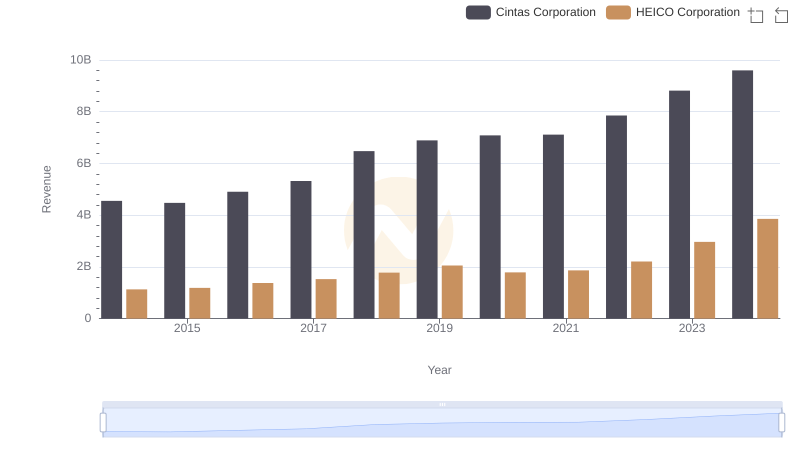
Breaking Down Revenue Trends: Cintas Corporation vs HEICO Corporation
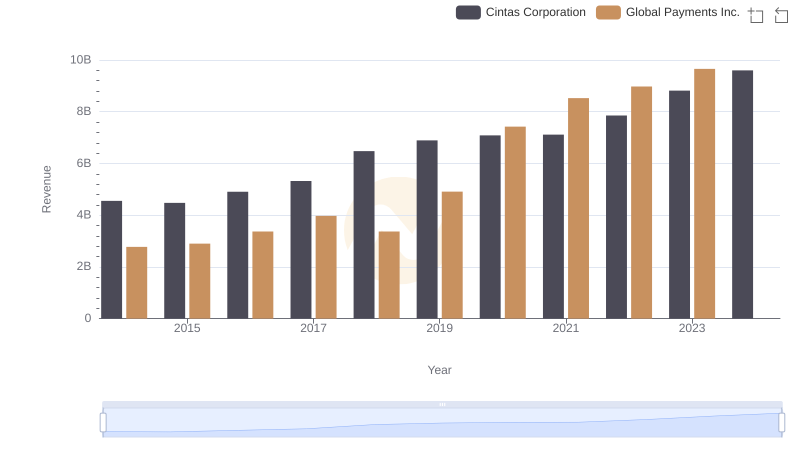
Comparing Revenue Performance: Cintas Corporation or Global Payments Inc.?
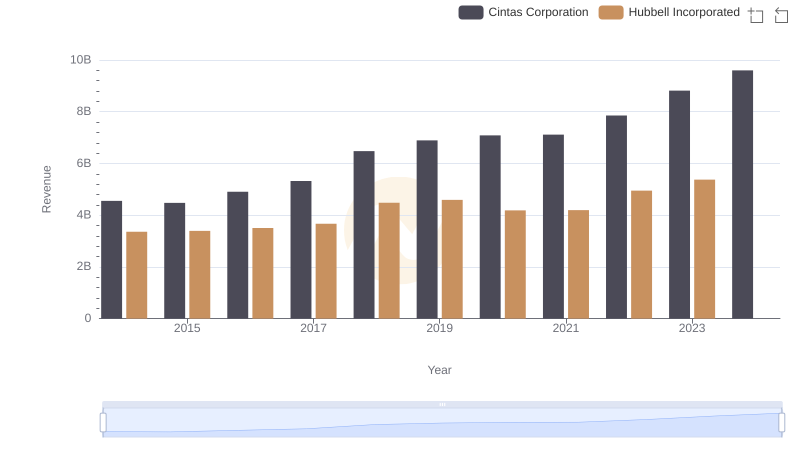
Comparing Revenue Performance: Cintas Corporation or Hubbell Incorporated?
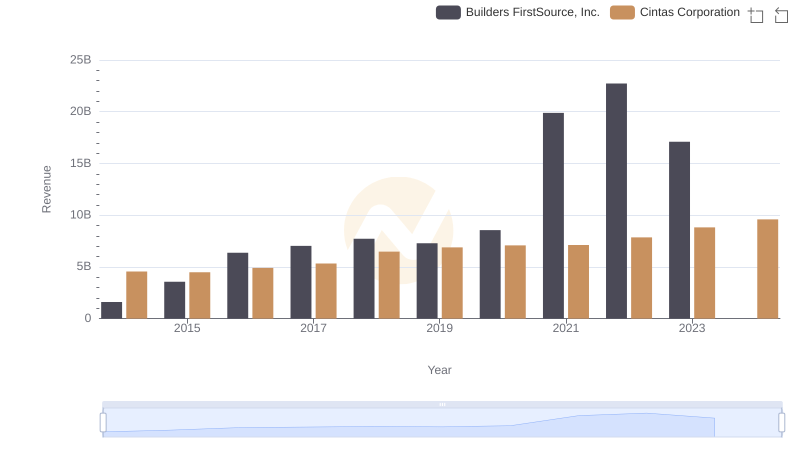
Cintas Corporation vs Builders FirstSource, Inc.: Annual Revenue Growth Compared
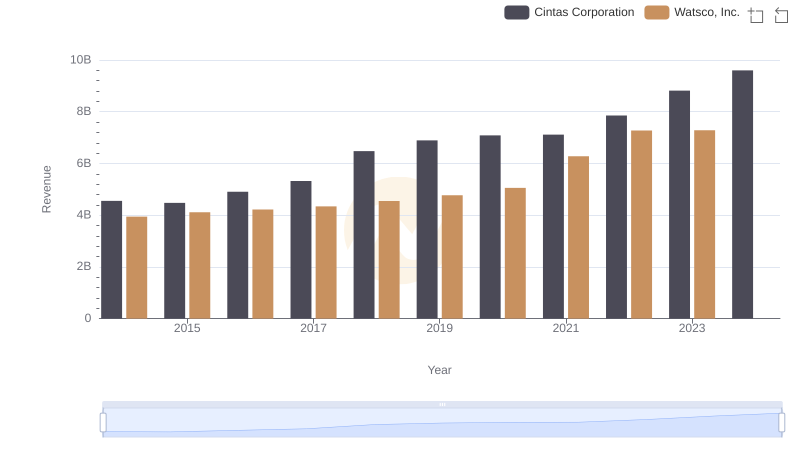
Cintas Corporation vs Watsco, Inc.: Examining Key Revenue Metrics
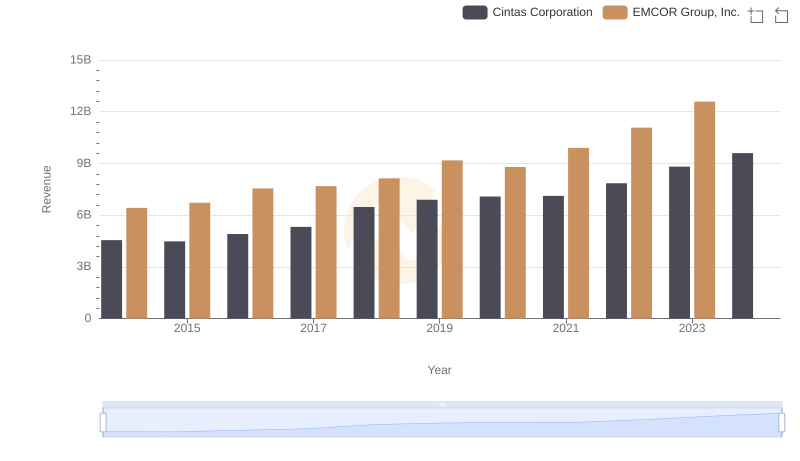
Cintas Corporation or EMCOR Group, Inc.: Who Leads in Yearly Revenue?
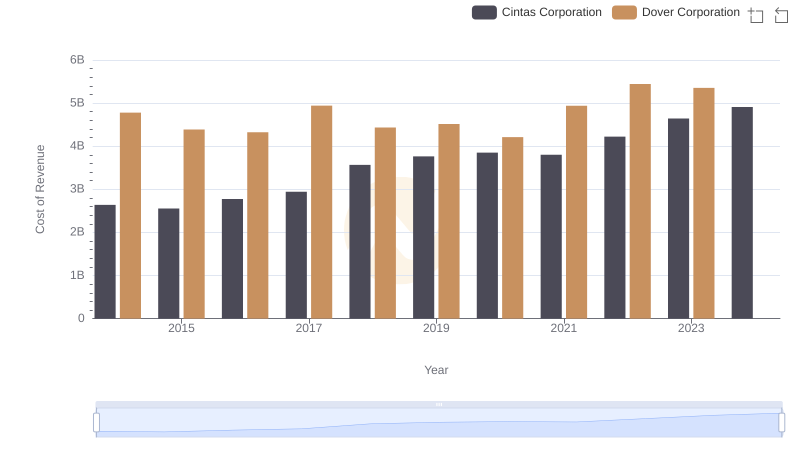
Cost of Revenue Trends: Cintas Corporation vs Dover Corporation
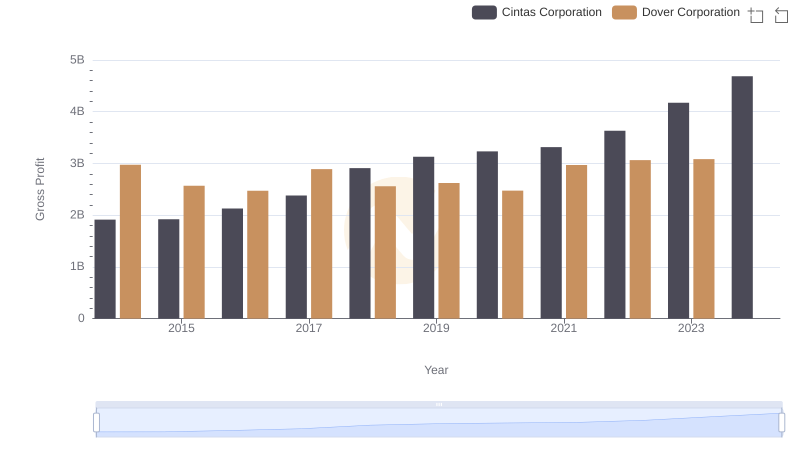
Gross Profit Analysis: Comparing Cintas Corporation and Dover Corporation
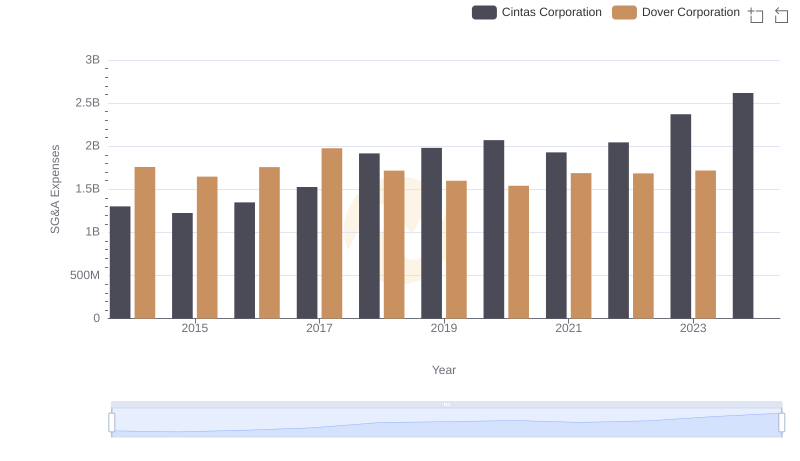
Cintas Corporation and Dover Corporation: SG&A Spending Patterns Compared
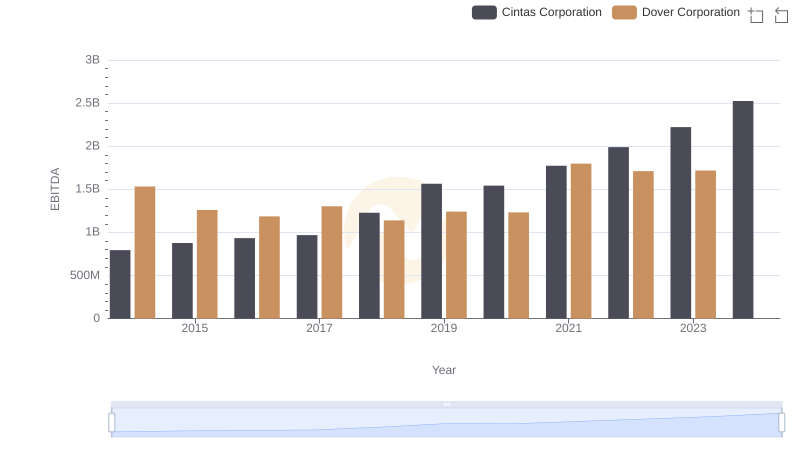
EBITDA Performance Review: Cintas Corporation vs Dover Corporation