| __timestamp | AerCap Holdings N.V. | Cintas Corporation |
|---|---|---|
| Wednesday, January 1, 2014 | 2252878000 | 2637426000 |
| Thursday, January 1, 2015 | 3776407000 | 2555549000 |
| Friday, January 1, 2016 | 3465727000 | 2775588000 |
| Sunday, January 1, 2017 | 3377439000 | 2943086000 |
| Monday, January 1, 2018 | 3299635000 | 3568109000 |
| Tuesday, January 1, 2019 | 3259091000 | 3763715000 |
| Wednesday, January 1, 2020 | 3217133000 | 3851372000 |
| Friday, January 1, 2021 | 3287413000 | 3801689000 |
| Saturday, January 1, 2022 | 4805277000 | 4222213000 |
| Sunday, January 1, 2023 | 3237016000 | 4642401000 |
| Monday, January 1, 2024 | 4910199000 |
Unveiling the hidden dimensions of data
In the ever-evolving landscape of global business, understanding cost dynamics is crucial. Cintas Corporation and AerCap Holdings N.V. offer a fascinating study in contrasts. From 2014 to 2023, Cintas Corporation's cost of revenue surged by approximately 76%, reflecting its robust growth trajectory. In contrast, AerCap Holdings N.V. experienced a more modest increase of around 44% over the same period.
Cintas Corporation, a leader in corporate identity uniforms, saw its cost of revenue rise steadily, peaking in 2023. This growth underscores its expanding market presence and operational scale. Meanwhile, AerCap Holdings N.V., a titan in aircraft leasing, faced fluctuations, with a notable spike in 2022, likely due to post-pandemic recovery efforts.
Interestingly, data for AerCap Holdings N.V. in 2024 is absent, leaving room for speculation on future trends. As these industry leaders navigate economic shifts, their cost strategies will be pivotal in shaping their competitive edge.
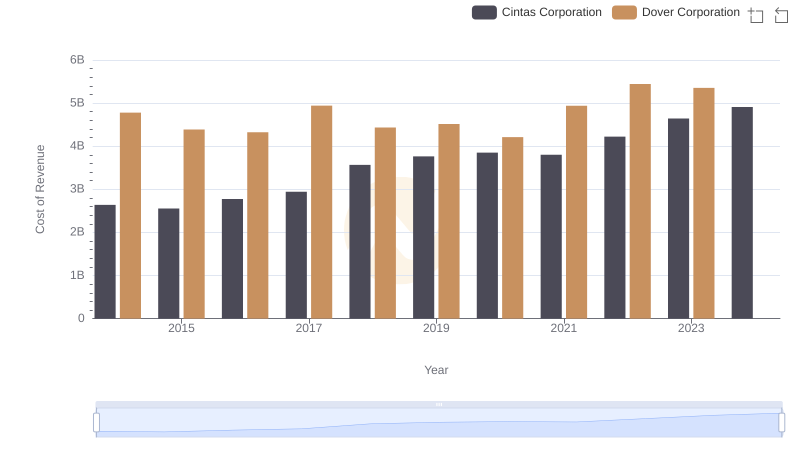
Cost of Revenue Trends: Cintas Corporation vs Dover Corporation
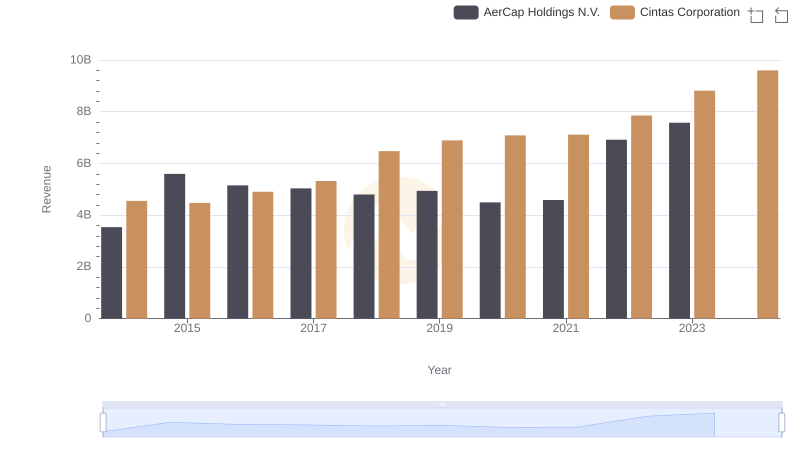
Annual Revenue Comparison: Cintas Corporation vs AerCap Holdings N.V.
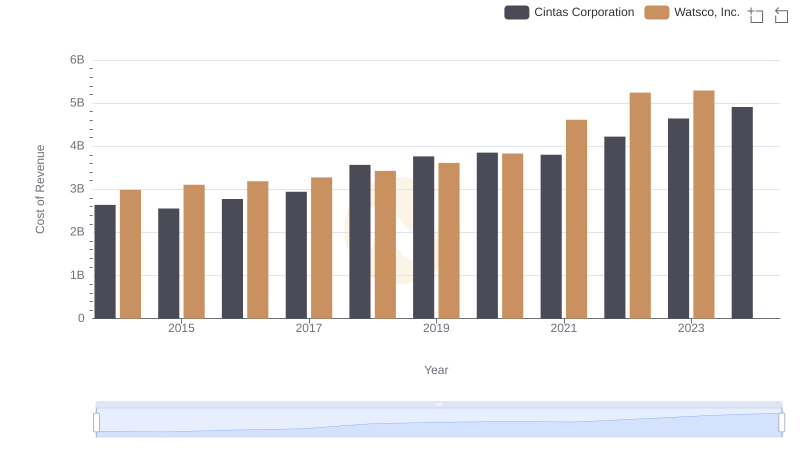
Cost of Revenue: Key Insights for Cintas Corporation and Watsco, Inc.
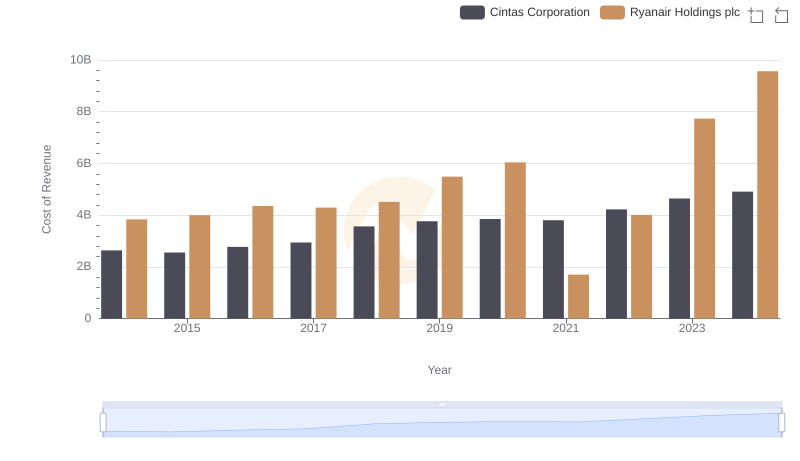
Cost Insights: Breaking Down Cintas Corporation and Ryanair Holdings plc's Expenses
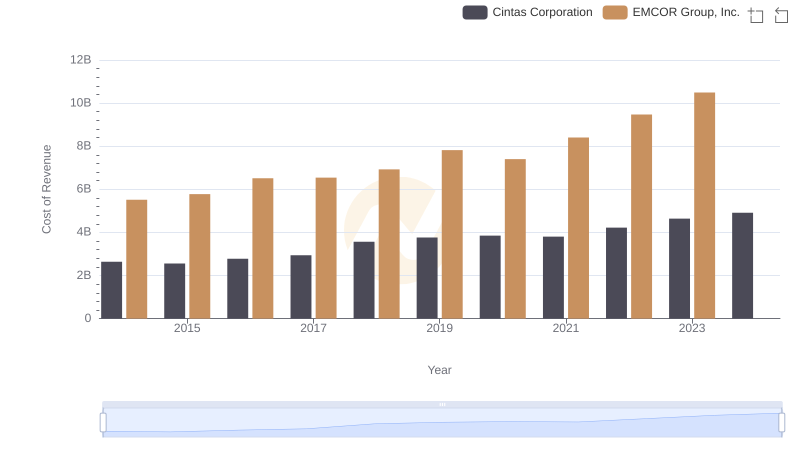
Comparing Cost of Revenue Efficiency: Cintas Corporation vs EMCOR Group, Inc.
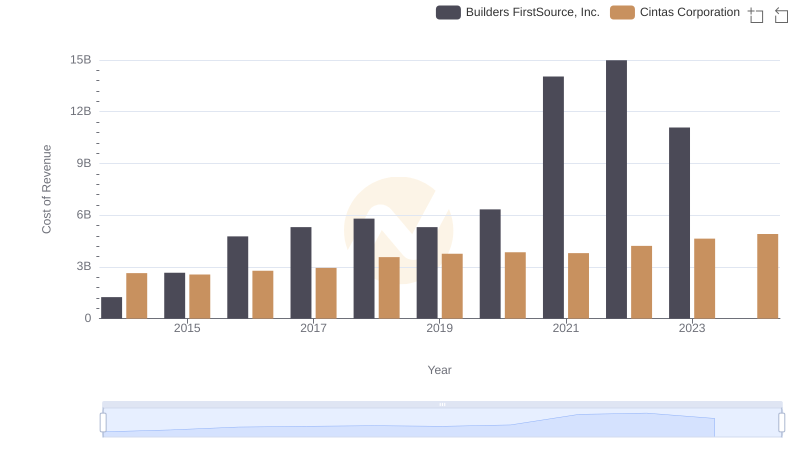
Comparing Cost of Revenue Efficiency: Cintas Corporation vs Builders FirstSource, Inc.
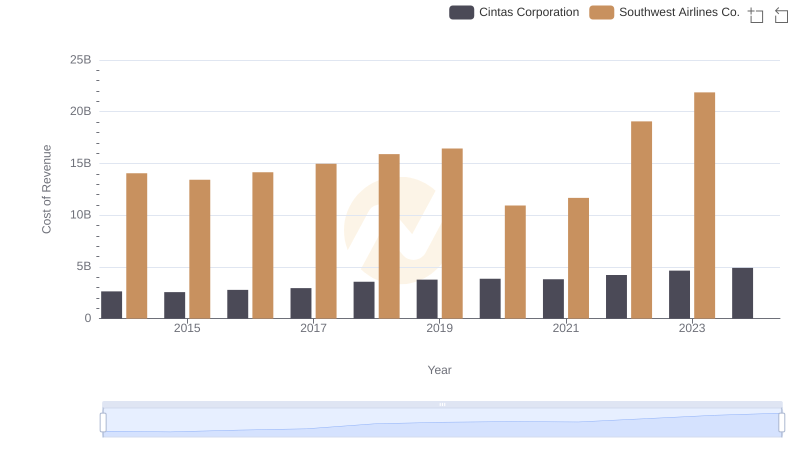
Comparing Cost of Revenue Efficiency: Cintas Corporation vs Southwest Airlines Co.
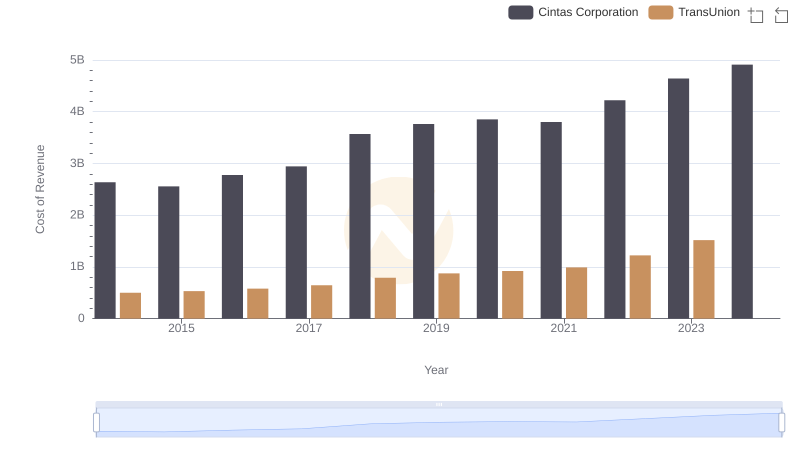
Cost of Revenue Trends: Cintas Corporation vs TransUnion

Who Generates Higher Gross Profit? Cintas Corporation or AerCap Holdings N.V.
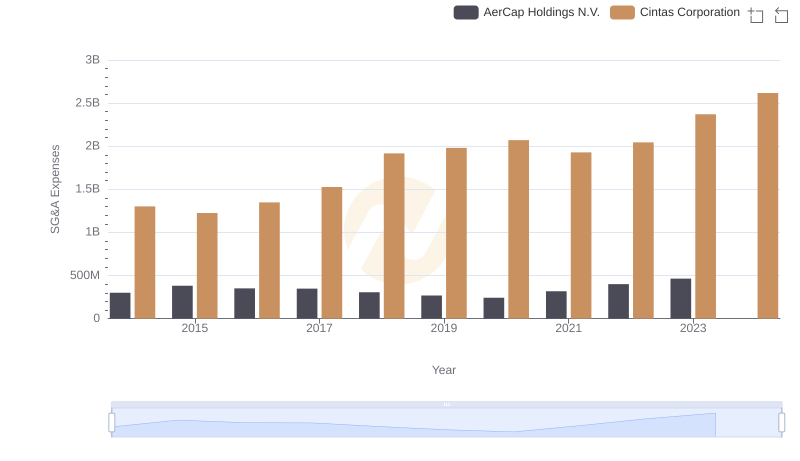
Selling, General, and Administrative Costs: Cintas Corporation vs AerCap Holdings N.V.
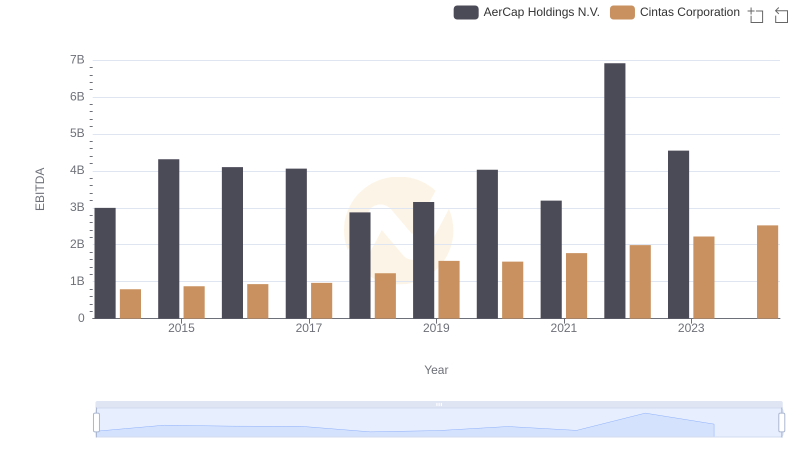
EBITDA Performance Review: Cintas Corporation vs AerCap Holdings N.V.