| __timestamp | International Business Machines Corporation | KLA Corporation |
|---|---|---|
| Wednesday, January 1, 2014 | 24962000000 | 855142000 |
| Thursday, January 1, 2015 | 20268000000 | 773476000 |
| Friday, January 1, 2016 | 17341000000 | 1036277000 |
| Sunday, January 1, 2017 | 16556000000 | 1276261000 |
| Monday, January 1, 2018 | 16545000000 | 1599878000 |
| Tuesday, January 1, 2019 | 14609000000 | 1620873000 |
| Wednesday, January 1, 2020 | 10555000000 | 2104221000 |
| Friday, January 1, 2021 | 12409000000 | 2851117000 |
| Saturday, January 1, 2022 | 7174000000 | 4012920000 |
| Sunday, January 1, 2023 | 14693000000 | 4406901000 |
| Monday, January 1, 2024 | 6015000000 | 3906779000 |
Unlocking the unknown
In the ever-evolving landscape of technology, the financial health of companies like International Business Machines Corporation (IBM) and KLA Corporation is pivotal. Over the past decade, IBM's EBITDA has seen a significant decline, dropping from its peak in 2014 to nearly 60% less by 2024. This trend reflects the challenges IBM faces in adapting to the rapidly changing tech environment. In contrast, KLA Corporation has demonstrated robust growth, with its EBITDA increasing by over 400% from 2014 to 2023, showcasing its strategic prowess in the semiconductor industry.
The data highlights a stark contrast in financial trajectories, with IBM's EBITDA fluctuating significantly, while KLA's steady rise underscores its resilience and adaptability. As we look to the future, these trends offer valuable insights into the strategic directions and market positions of these tech giants.
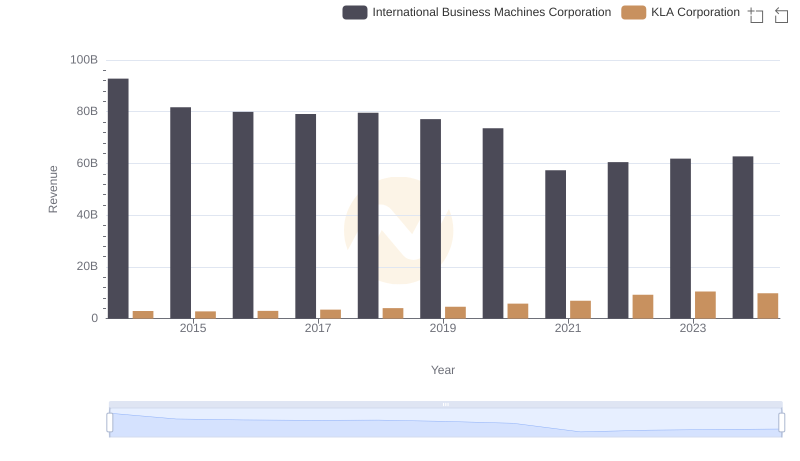
Breaking Down Revenue Trends: International Business Machines Corporation vs KLA Corporation
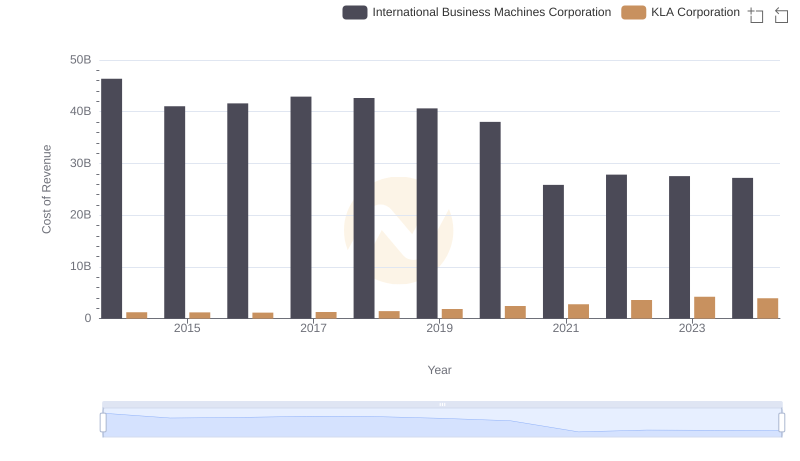
Cost Insights: Breaking Down International Business Machines Corporation and KLA Corporation's Expenses
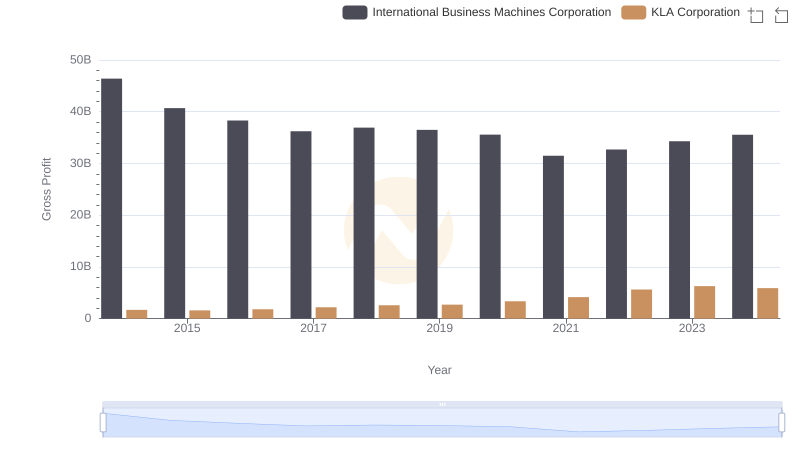
International Business Machines Corporation vs KLA Corporation: A Gross Profit Performance Breakdown
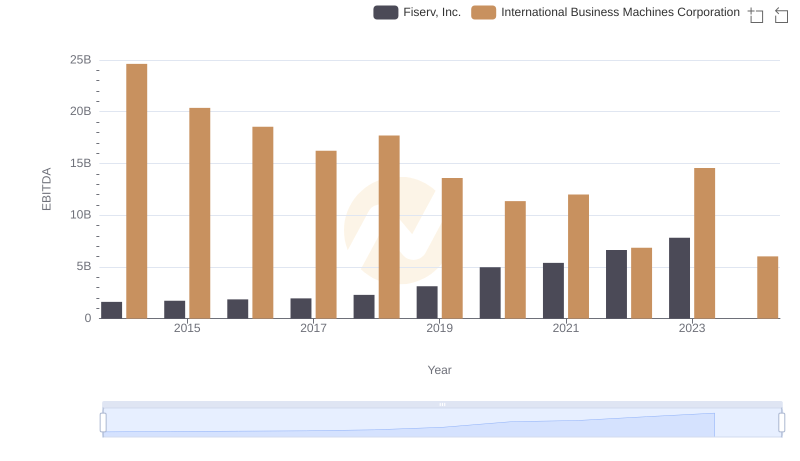
International Business Machines Corporation vs Fiserv, Inc.: In-Depth EBITDA Performance Comparison
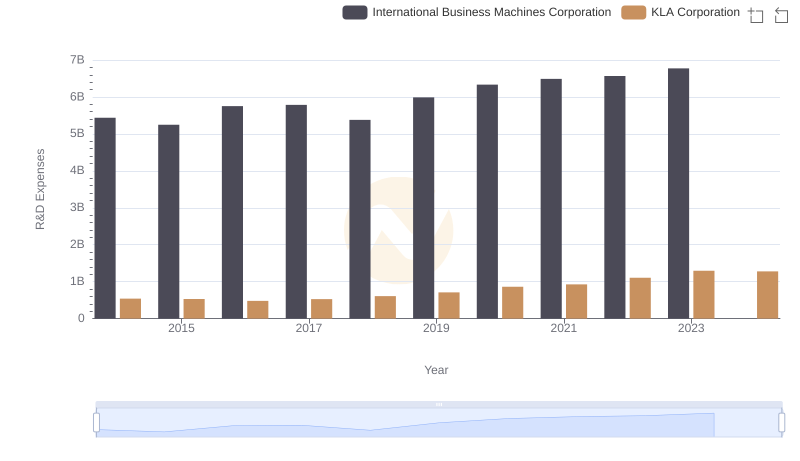
Analyzing R&D Budgets: International Business Machines Corporation vs KLA Corporation
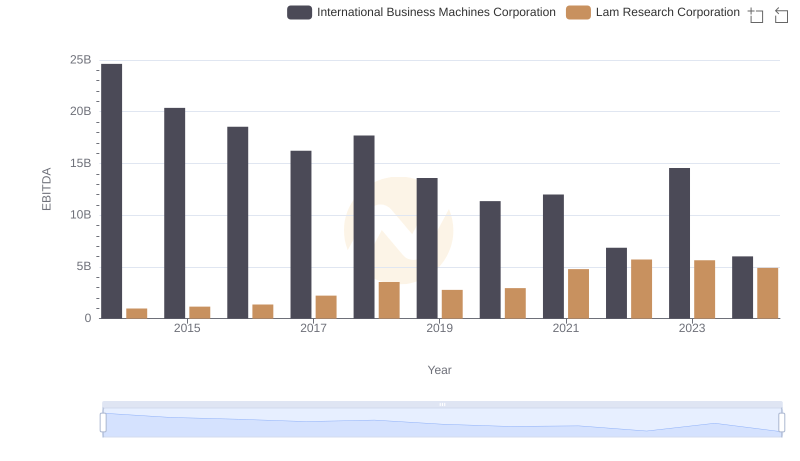
Professional EBITDA Benchmarking: International Business Machines Corporation vs Lam Research Corporation
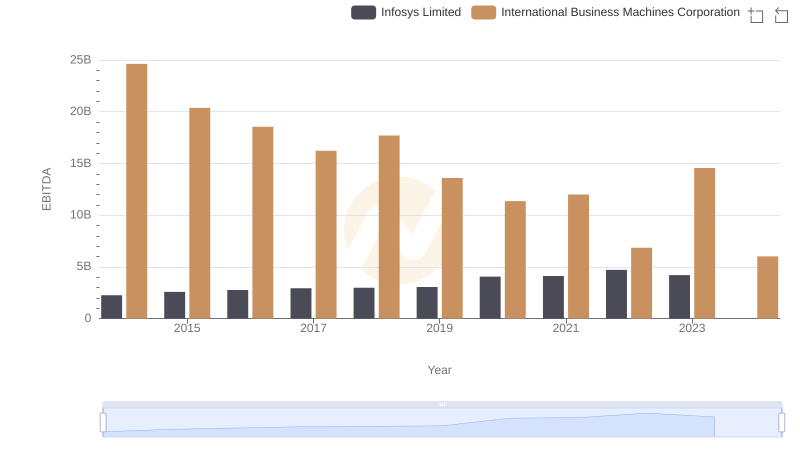
EBITDA Metrics Evaluated: International Business Machines Corporation vs Infosys Limited
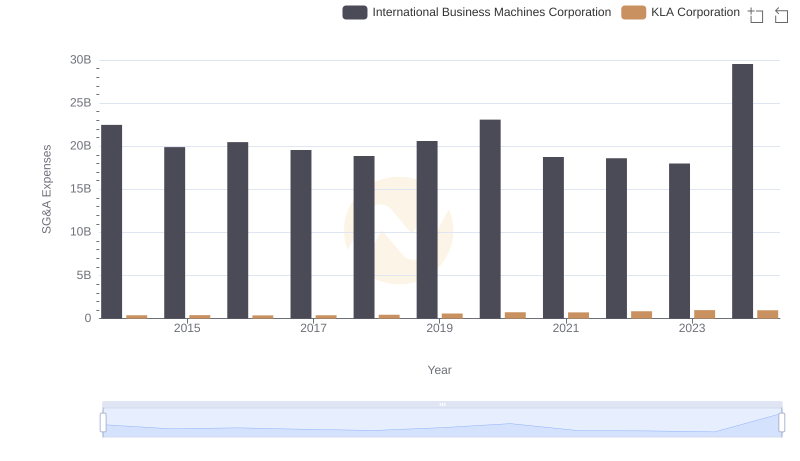
Selling, General, and Administrative Costs: International Business Machines Corporation vs KLA Corporation
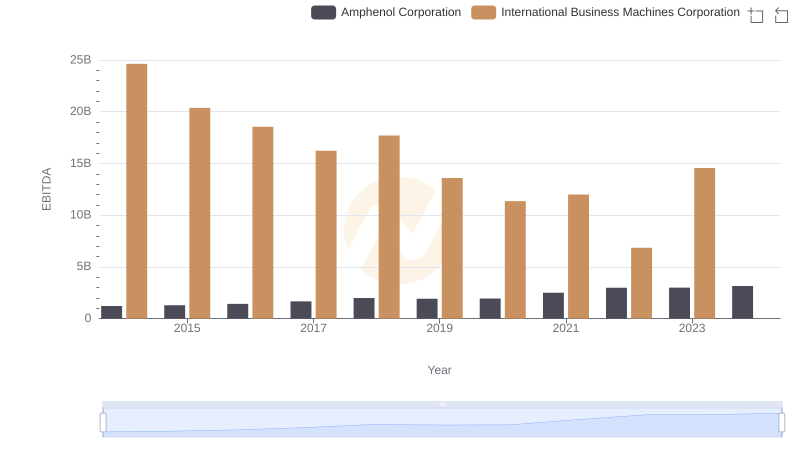
A Side-by-Side Analysis of EBITDA: International Business Machines Corporation and Amphenol Corporation
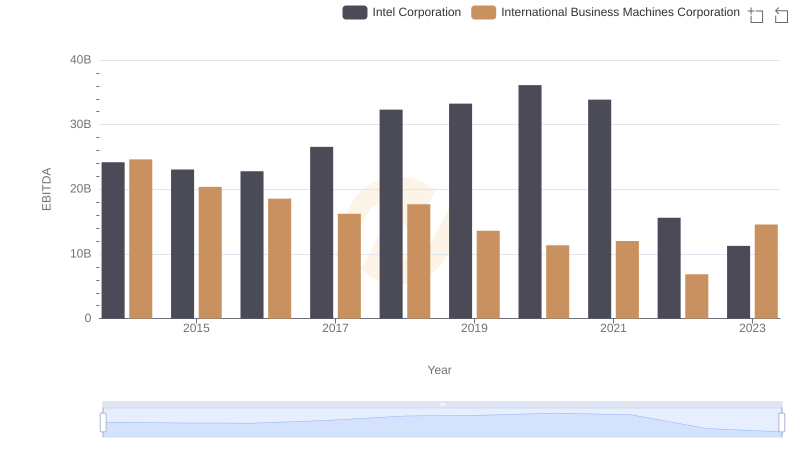
Comparative EBITDA Analysis: International Business Machines Corporation vs Intel Corporation
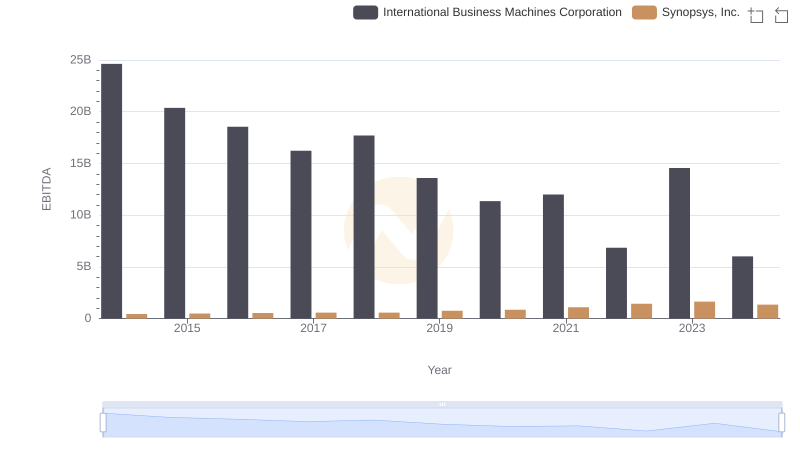
International Business Machines Corporation and Synopsys, Inc.: A Detailed Examination of EBITDA Performance
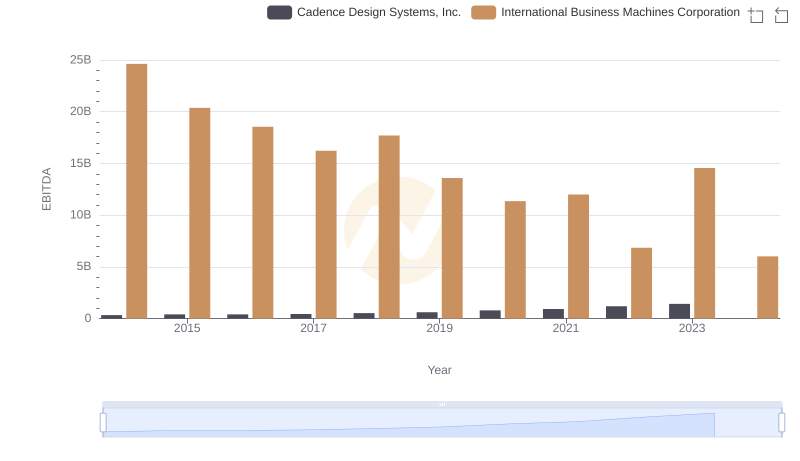
EBITDA Analysis: Evaluating International Business Machines Corporation Against Cadence Design Systems, Inc.