| __timestamp | International Business Machines Corporation | KLA Corporation |
|---|---|---|
| Wednesday, January 1, 2014 | 92793000000 | 2929408000 |
| Thursday, January 1, 2015 | 81742000000 | 2814049000 |
| Friday, January 1, 2016 | 79920000000 | 2984493000 |
| Sunday, January 1, 2017 | 79139000000 | 3480014000 |
| Monday, January 1, 2018 | 79591000000 | 4036701000 |
| Tuesday, January 1, 2019 | 57714000000 | 4568904000 |
| Wednesday, January 1, 2020 | 55179000000 | 5806424000 |
| Friday, January 1, 2021 | 57351000000 | 6918734000 |
| Saturday, January 1, 2022 | 60530000000 | 9211883000 |
| Sunday, January 1, 2023 | 61860000000 | 10496056000 |
| Monday, January 1, 2024 | 62753000000 | 9812247000 |
Unlocking the unknown
In the ever-evolving landscape of technology, the revenue trajectories of industry giants like International Business Machines Corporation (IBM) and KLA Corporation offer a fascinating glimpse into their strategic adaptations over the past decade. From 2014 to 2024, IBM's revenue has seen a notable decline of approximately 32%, reflecting a shift in its business model and market challenges. In contrast, KLA Corporation has experienced a remarkable growth of around 235%, underscoring its robust position in the semiconductor industry.
IBM's revenue peaked in 2014, but by 2021, it had dropped significantly, highlighting the company's transition towards cloud computing and AI. Meanwhile, KLA's consistent upward trend, especially post-2018, showcases its strategic focus on semiconductor process control. As we look towards 2024, these trends emphasize the dynamic nature of the tech industry and the importance of innovation and adaptation.
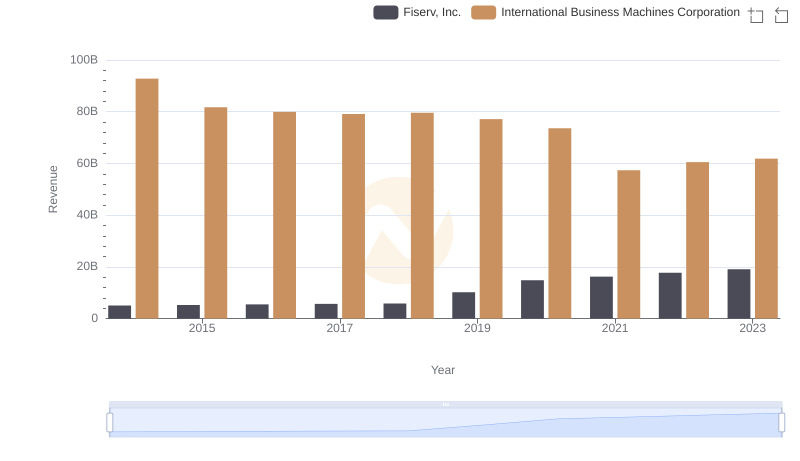
Breaking Down Revenue Trends: International Business Machines Corporation vs Fiserv, Inc.
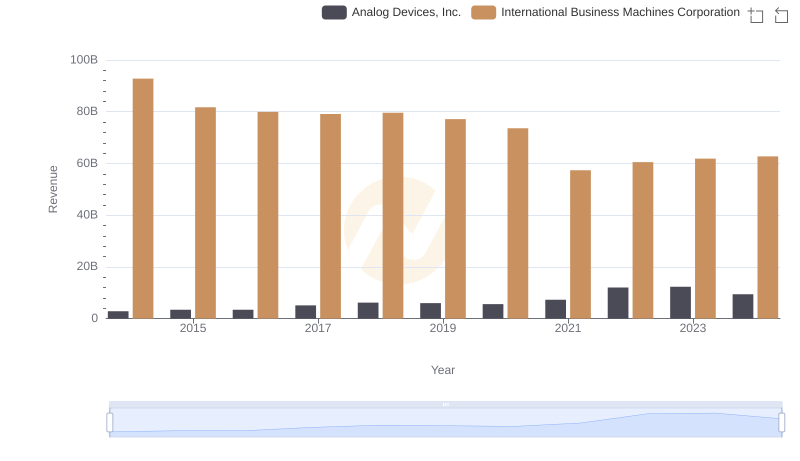
International Business Machines Corporation vs Analog Devices, Inc.: Examining Key Revenue Metrics
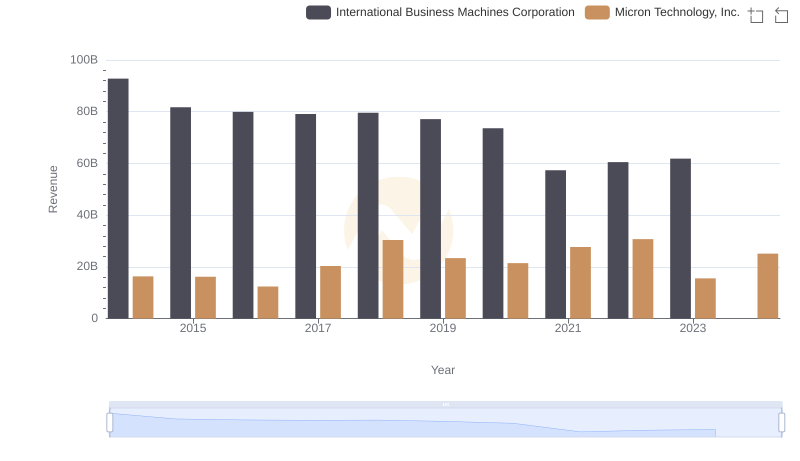
International Business Machines Corporation vs Micron Technology, Inc.: Examining Key Revenue Metrics
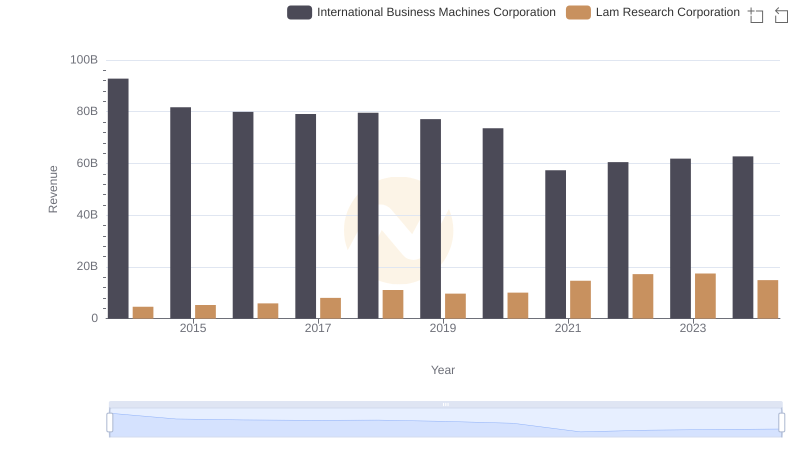
International Business Machines Corporation or Lam Research Corporation: Who Leads in Yearly Revenue?
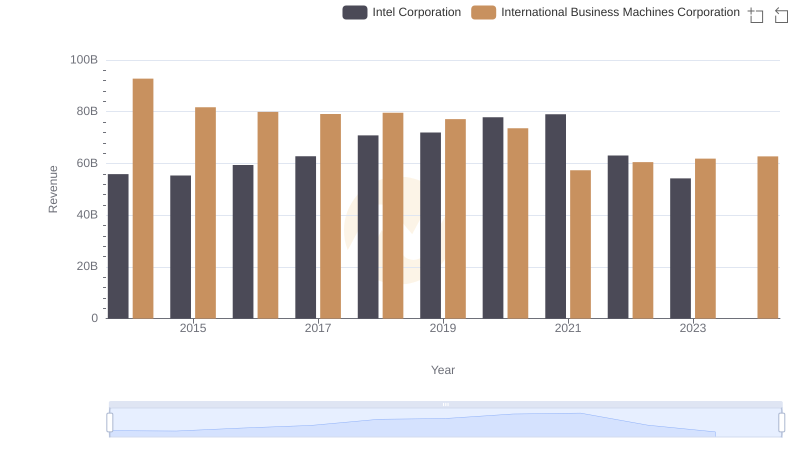
International Business Machines Corporation or Intel Corporation: Who Leads in Yearly Revenue?
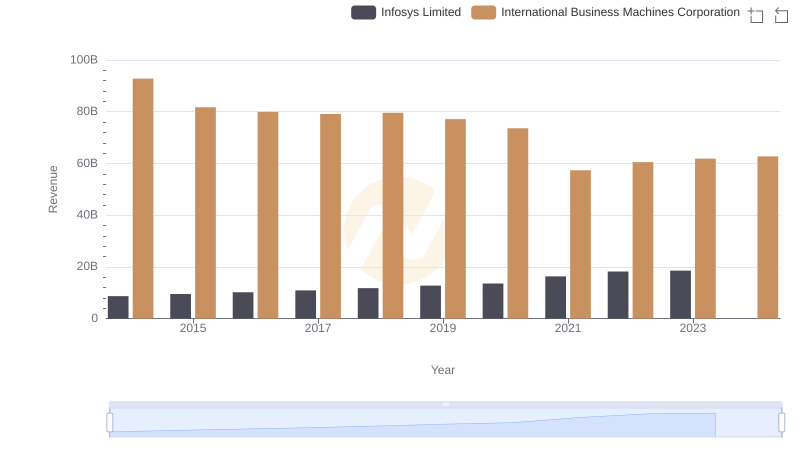
Revenue Insights: International Business Machines Corporation and Infosys Limited Performance Compared
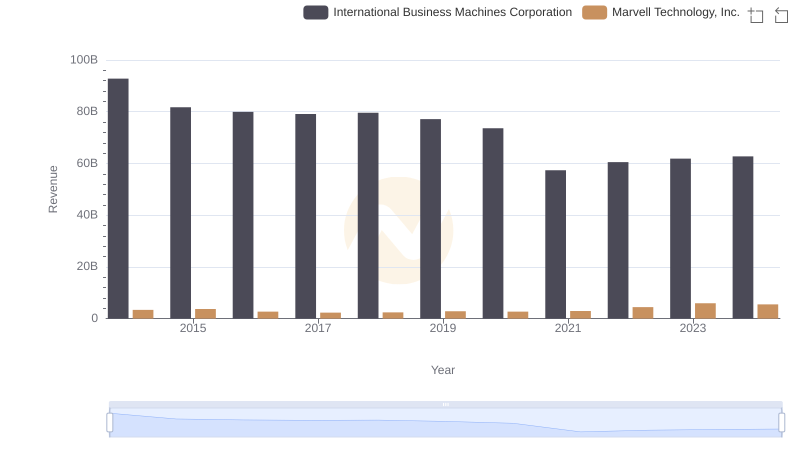
International Business Machines Corporation vs Marvell Technology, Inc.: Annual Revenue Growth Compared
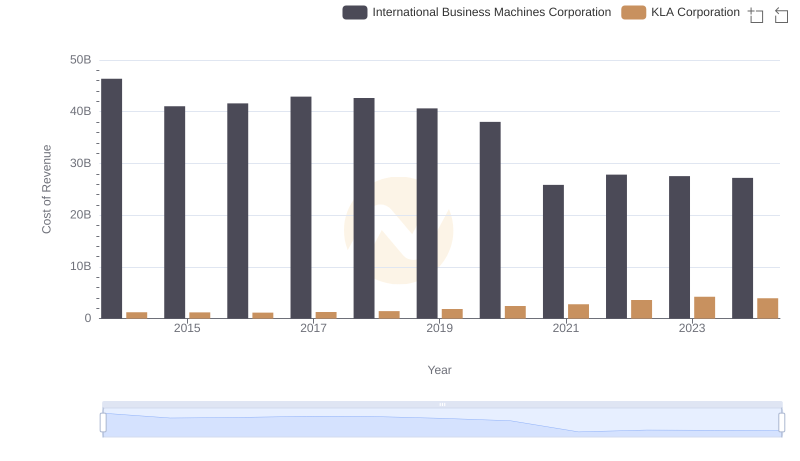
Cost Insights: Breaking Down International Business Machines Corporation and KLA Corporation's Expenses
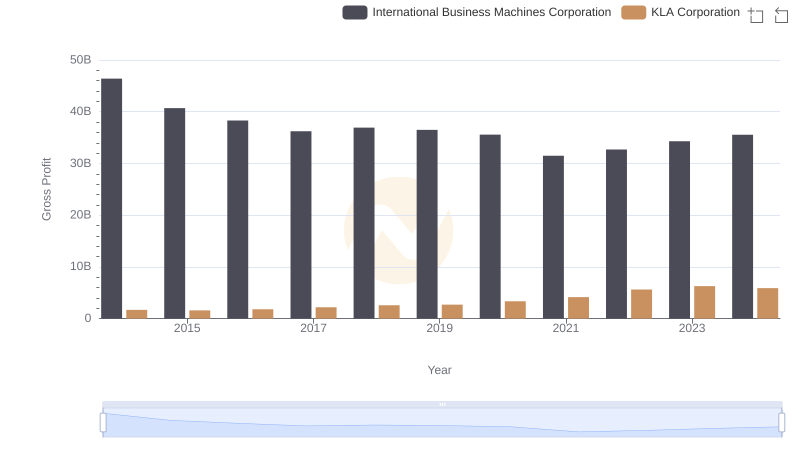
International Business Machines Corporation vs KLA Corporation: A Gross Profit Performance Breakdown
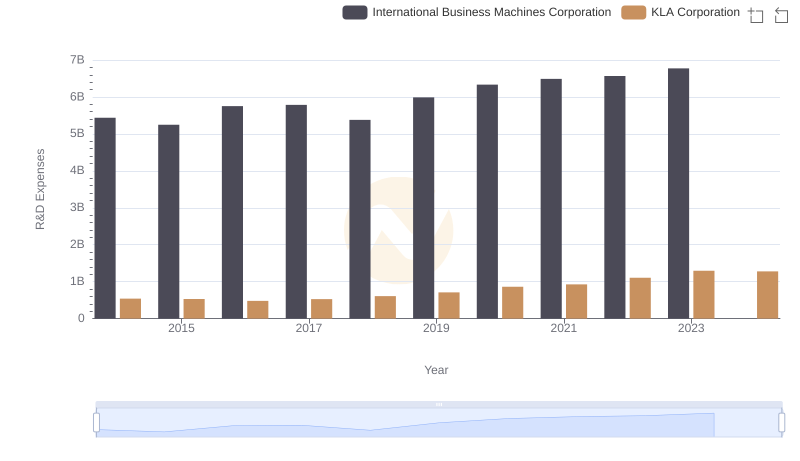
Analyzing R&D Budgets: International Business Machines Corporation vs KLA Corporation
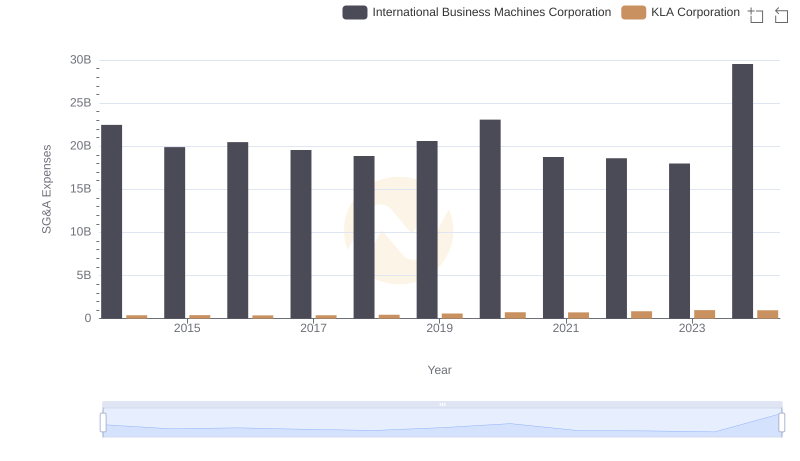
Selling, General, and Administrative Costs: International Business Machines Corporation vs KLA Corporation
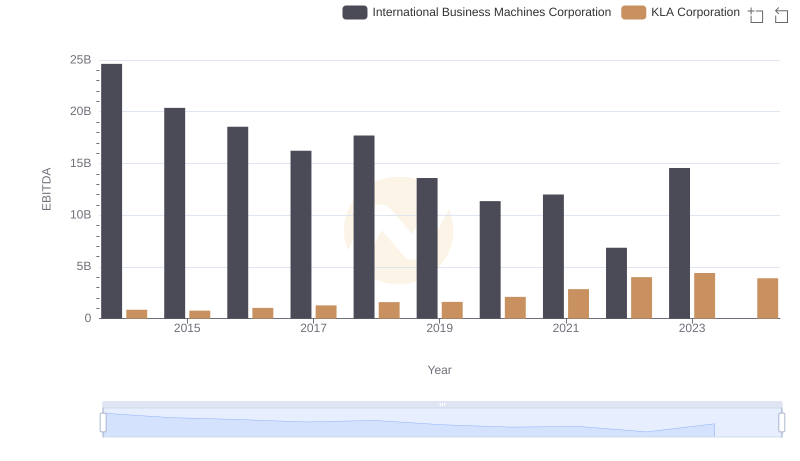
EBITDA Metrics Evaluated: International Business Machines Corporation vs KLA Corporation