| __timestamp | International Business Machines Corporation | KLA Corporation |
|---|---|---|
| Wednesday, January 1, 2014 | 46386000000 | 1232962000 |
| Thursday, January 1, 2015 | 41057000000 | 1215229000 |
| Friday, January 1, 2016 | 41403000000 | 1163391000 |
| Sunday, January 1, 2017 | 42196000000 | 1287547000 |
| Monday, January 1, 2018 | 42655000000 | 1447369000 |
| Tuesday, January 1, 2019 | 26181000000 | 1869377000 |
| Wednesday, January 1, 2020 | 24314000000 | 2449561000 |
| Friday, January 1, 2021 | 25865000000 | 2772165000 |
| Saturday, January 1, 2022 | 27842000000 | 3592441000 |
| Sunday, January 1, 2023 | 27560000000 | 4218307000 |
| Monday, January 1, 2024 | 27202000000 | 3928073000 |
Unleashing the power of data
In the ever-evolving landscape of technology, understanding the cost dynamics of industry giants like International Business Machines Corporation (IBM) and KLA Corporation is crucial. Over the past decade, IBM's cost of revenue has seen a significant decline, dropping by approximately 41% from 2014 to 2024. This trend reflects IBM's strategic shift towards more efficient operations and possibly a focus on high-margin services.
Conversely, KLA Corporation, a leader in semiconductor manufacturing, has experienced a remarkable increase in its cost of revenue, surging by over 200% during the same period. This rise underscores KLA's aggressive expansion and investment in cutting-edge technologies to meet the growing demand in the semiconductor industry.
These contrasting trends highlight the diverse strategies employed by these tech titans to navigate the competitive landscape, offering valuable insights into their operational priorities and market positioning.
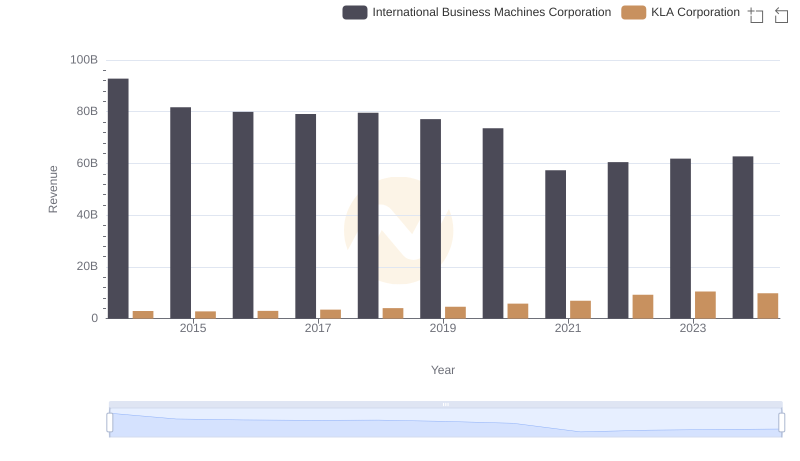
Breaking Down Revenue Trends: International Business Machines Corporation vs KLA Corporation
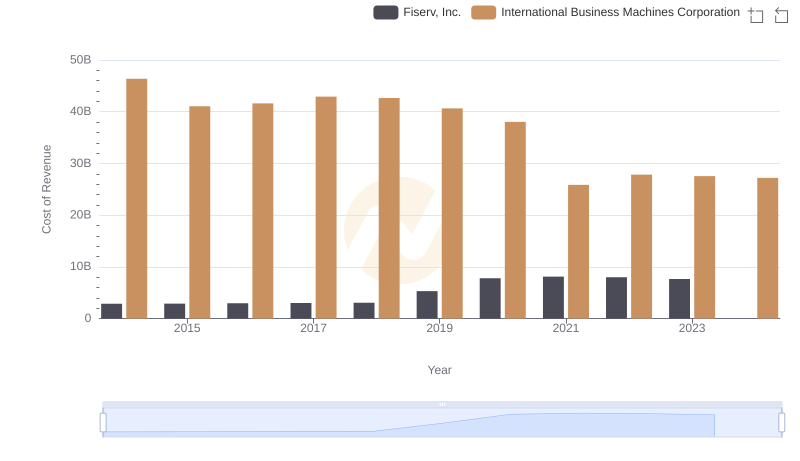
Analyzing Cost of Revenue: International Business Machines Corporation and Fiserv, Inc.
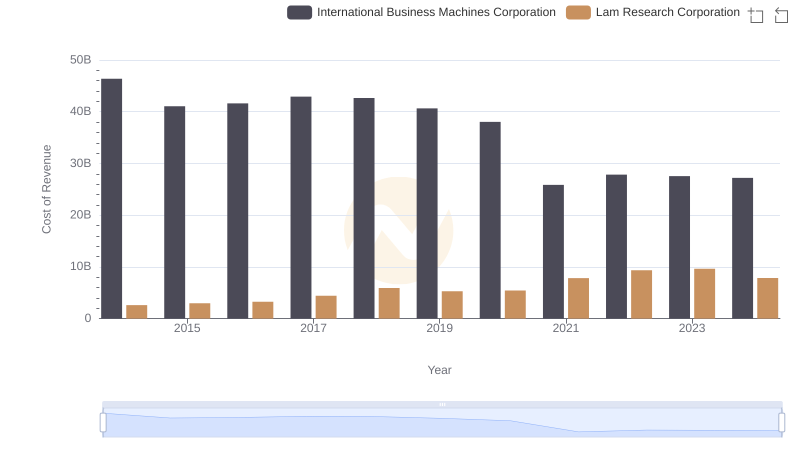
Analyzing Cost of Revenue: International Business Machines Corporation and Lam Research Corporation
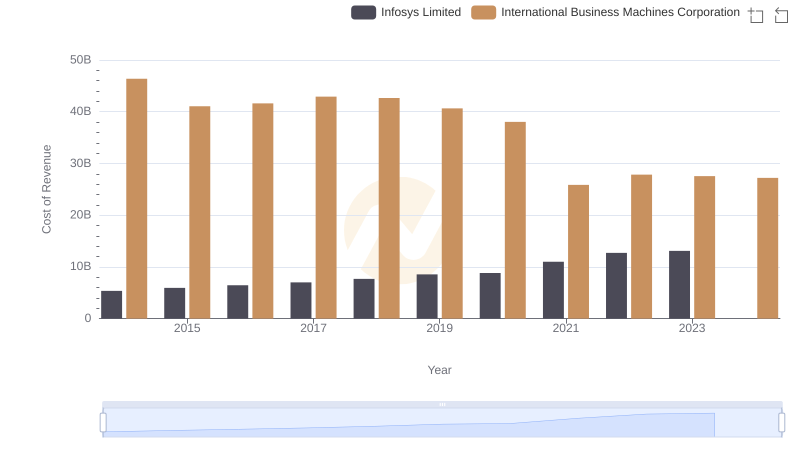
International Business Machines Corporation vs Infosys Limited: Efficiency in Cost of Revenue Explored
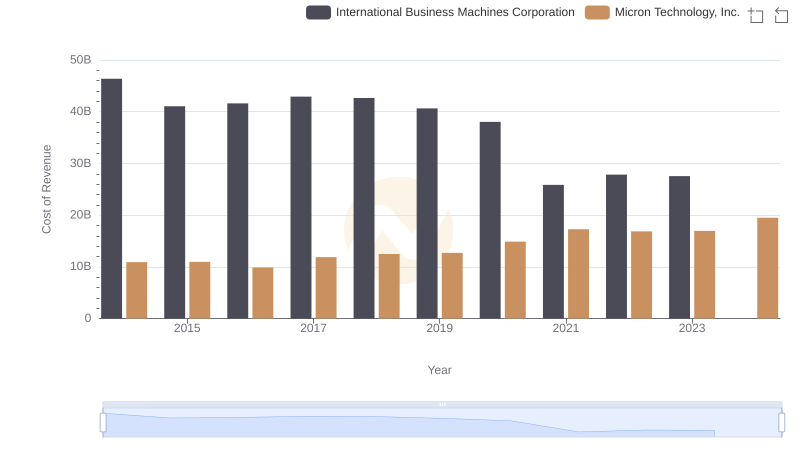
Cost of Revenue: Key Insights for International Business Machines Corporation and Micron Technology, Inc.
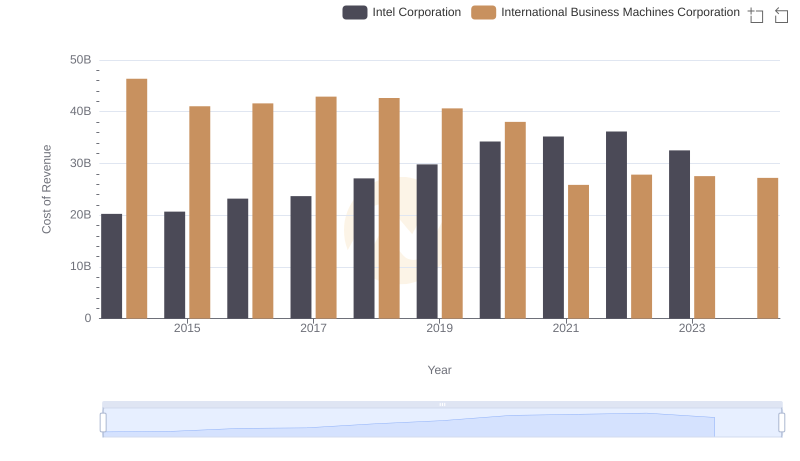
Cost Insights: Breaking Down International Business Machines Corporation and Intel Corporation's Expenses
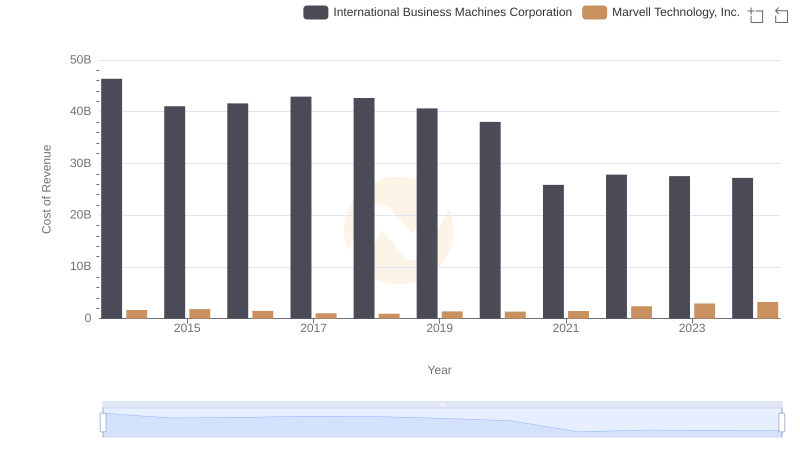
Cost Insights: Breaking Down International Business Machines Corporation and Marvell Technology, Inc.'s Expenses
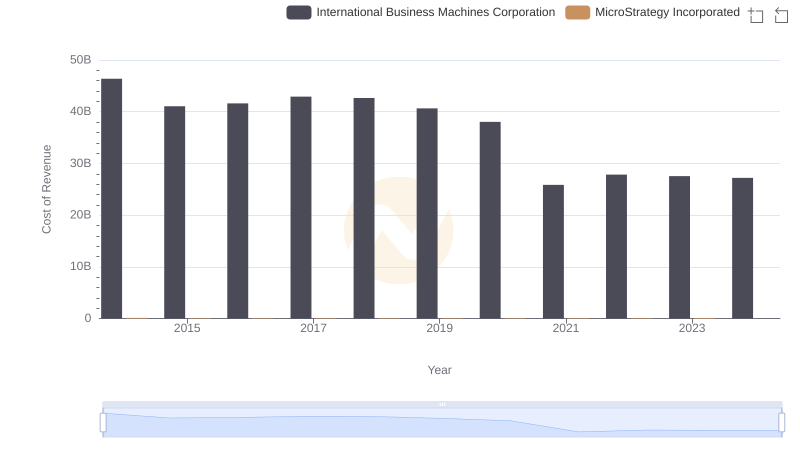
Cost of Revenue: Key Insights for International Business Machines Corporation and MicroStrategy Incorporated
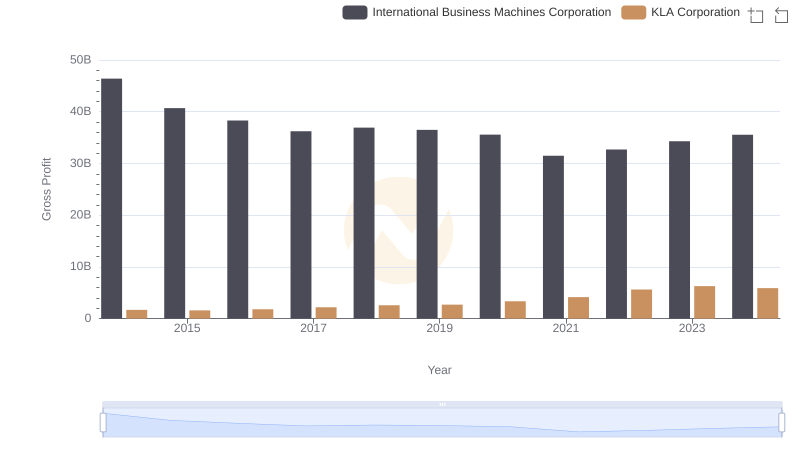
International Business Machines Corporation vs KLA Corporation: A Gross Profit Performance Breakdown
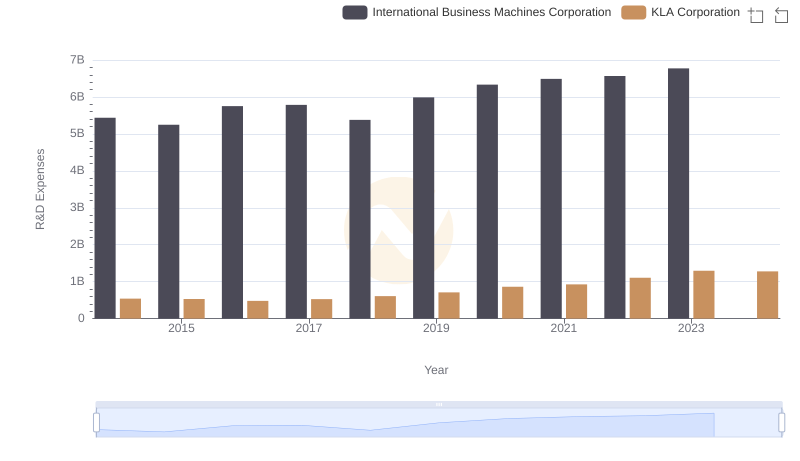
Analyzing R&D Budgets: International Business Machines Corporation vs KLA Corporation
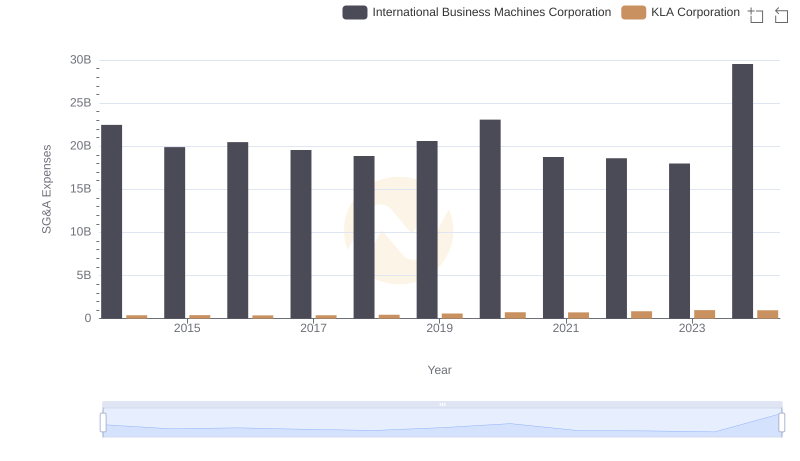
Selling, General, and Administrative Costs: International Business Machines Corporation vs KLA Corporation
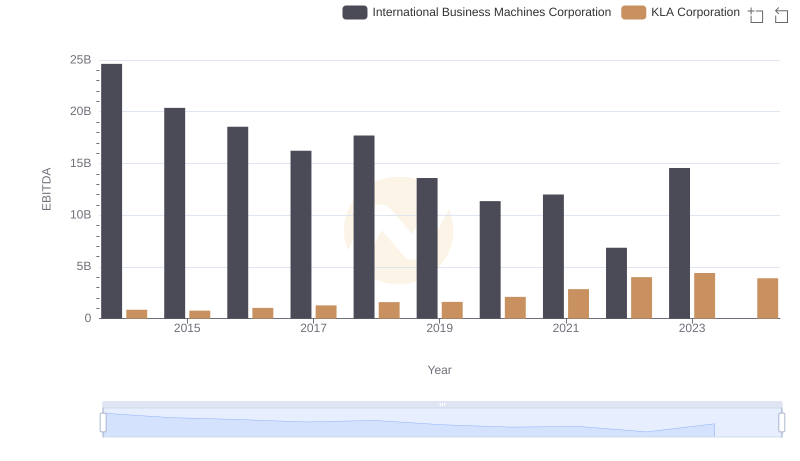
EBITDA Metrics Evaluated: International Business Machines Corporation vs KLA Corporation