| __timestamp | Amphenol Corporation | International Business Machines Corporation |
|---|---|---|
| Wednesday, January 1, 2014 | 1221000000 | 24962000000 |
| Thursday, January 1, 2015 | 1292700000 | 20268000000 |
| Friday, January 1, 2016 | 1430700000 | 17341000000 |
| Sunday, January 1, 2017 | 1671500000 | 16556000000 |
| Monday, January 1, 2018 | 1989800000 | 16545000000 |
| Tuesday, January 1, 2019 | 1925600000 | 14609000000 |
| Wednesday, January 1, 2020 | 1950100000 | 10555000000 |
| Friday, January 1, 2021 | 2500300000 | 12409000000 |
| Saturday, January 1, 2022 | 2988700000 | 7174000000 |
| Sunday, January 1, 2023 | 3000700000 | 14693000000 |
| Monday, January 1, 2024 | 3875100000 | 6015000000 |
Unlocking the unknown
In the ever-evolving landscape of technology and electronics, two giants stand out: International Business Machines Corporation (IBM) and Amphenol Corporation. Over the past decade, these companies have showcased contrasting trajectories in their EBITDA performance. From 2014 to 2024, IBM's EBITDA has seen a significant decline, dropping from a peak of approximately $24.6 billion in 2014 to around $6 billion in 2024. This represents a staggering 76% decrease, reflecting the challenges IBM faces in adapting to the rapidly changing tech environment.
Conversely, Amphenol Corporation has demonstrated a robust growth pattern. Starting at $1.2 billion in 2014, Amphenol's EBITDA has more than doubled, reaching over $3.1 billion in 2024. This impressive 158% increase underscores Amphenol's strategic positioning and adaptability in the electronics sector. As we delve into these figures, it becomes evident that while IBM grapples with transformation, Amphenol thrives on innovation.
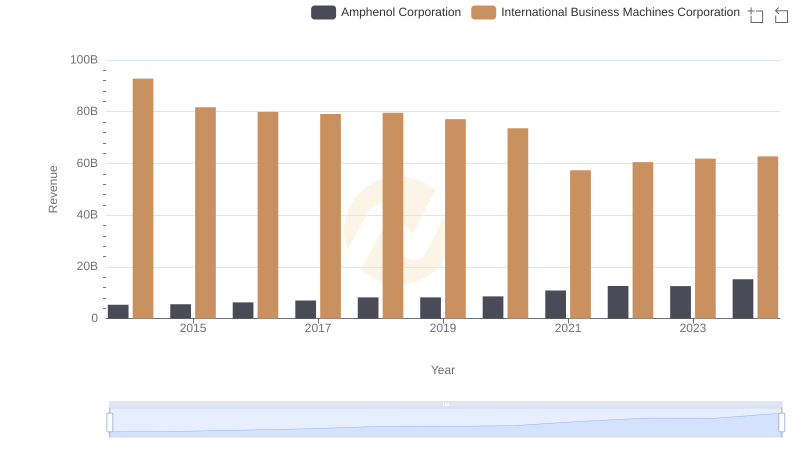
Revenue Insights: International Business Machines Corporation and Amphenol Corporation Performance Compared
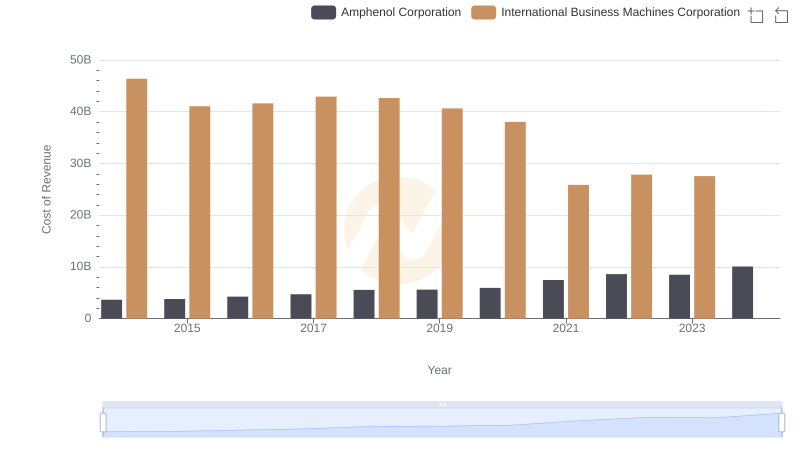
Comparing Cost of Revenue Efficiency: International Business Machines Corporation vs Amphenol Corporation
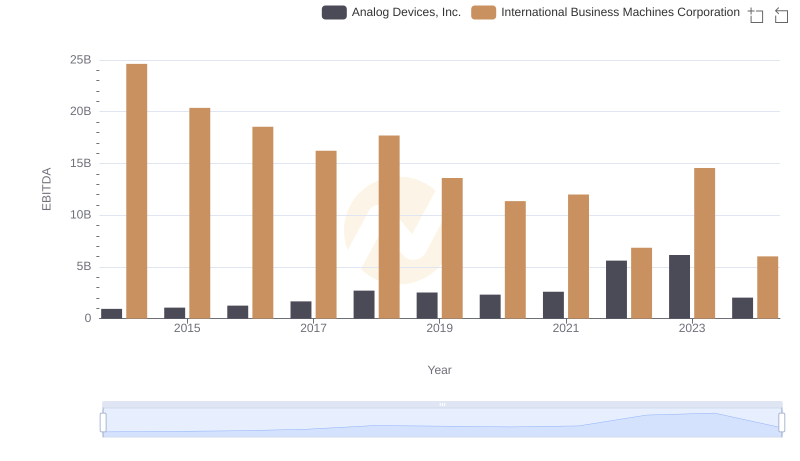
EBITDA Analysis: Evaluating International Business Machines Corporation Against Analog Devices, Inc.
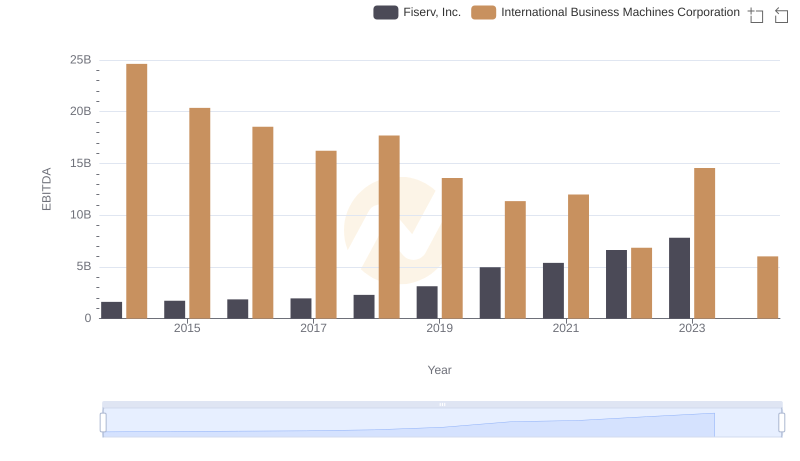
International Business Machines Corporation vs Fiserv, Inc.: In-Depth EBITDA Performance Comparison
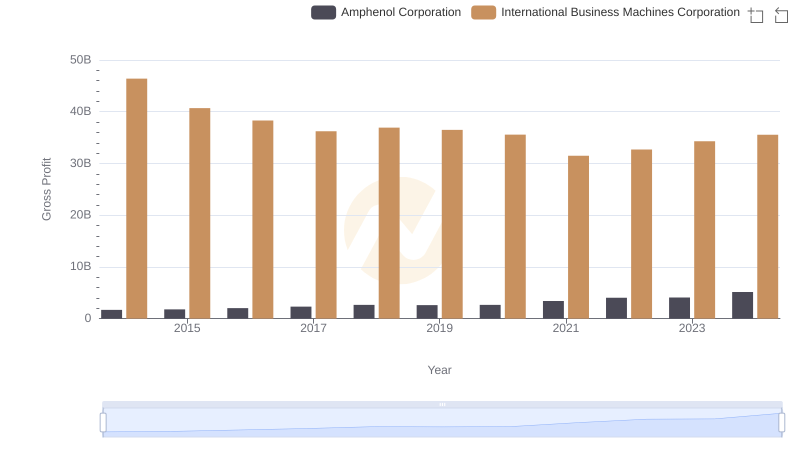
Who Generates Higher Gross Profit? International Business Machines Corporation or Amphenol Corporation
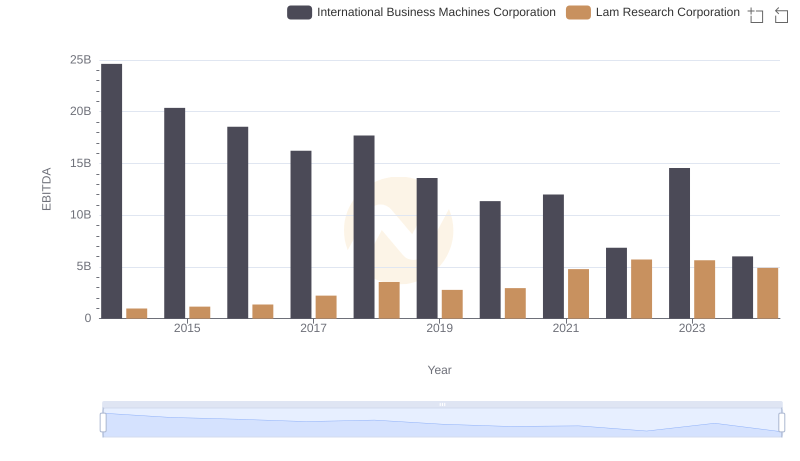
Professional EBITDA Benchmarking: International Business Machines Corporation vs Lam Research Corporation
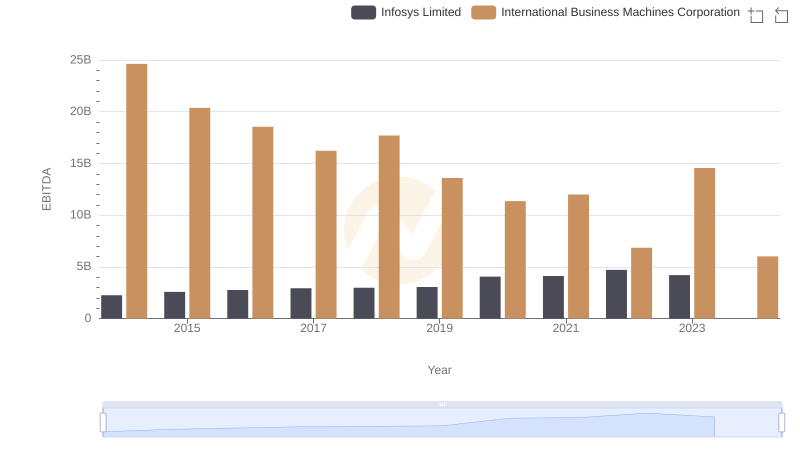
EBITDA Metrics Evaluated: International Business Machines Corporation vs Infosys Limited
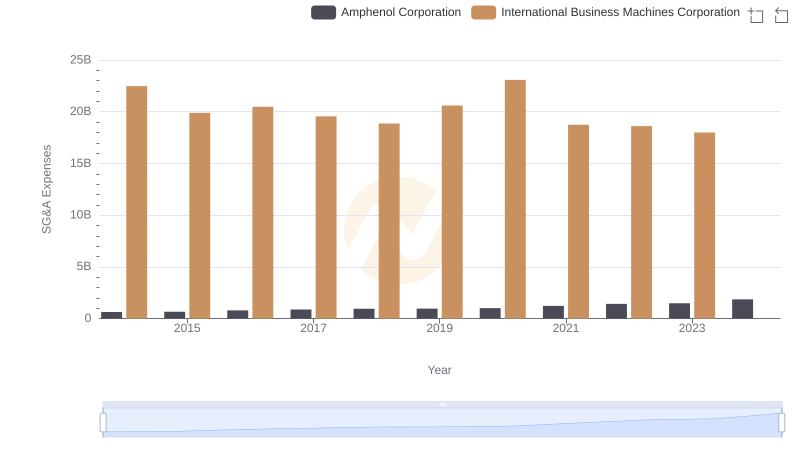
International Business Machines Corporation or Amphenol Corporation: Who Manages SG&A Costs Better?
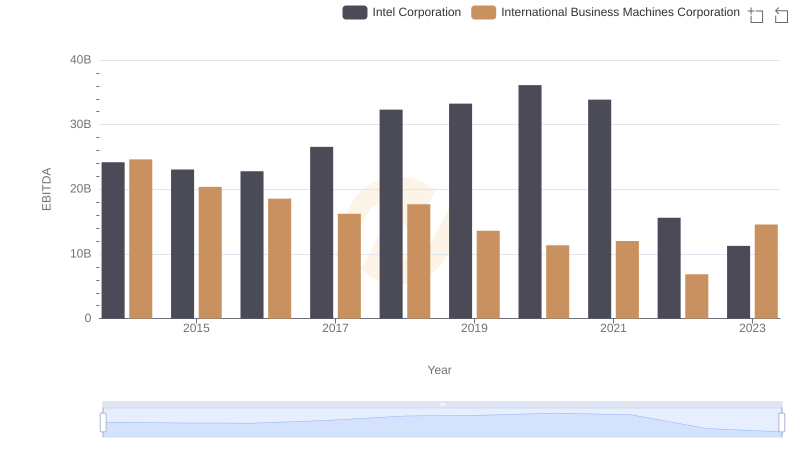
Comparative EBITDA Analysis: International Business Machines Corporation vs Intel Corporation
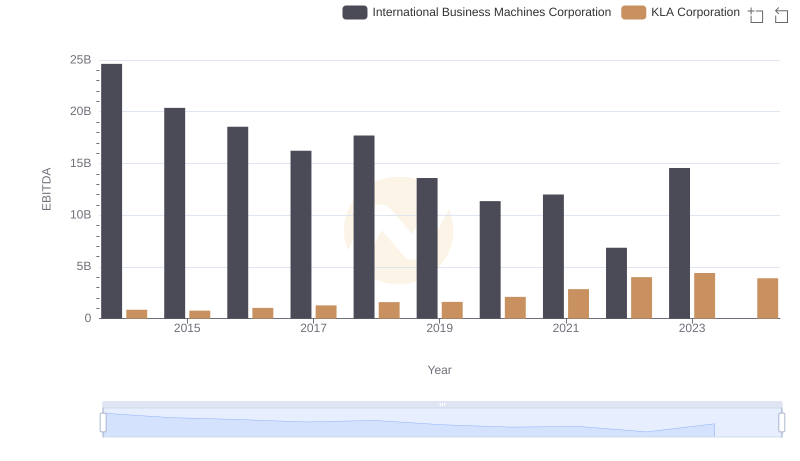
EBITDA Metrics Evaluated: International Business Machines Corporation vs KLA Corporation
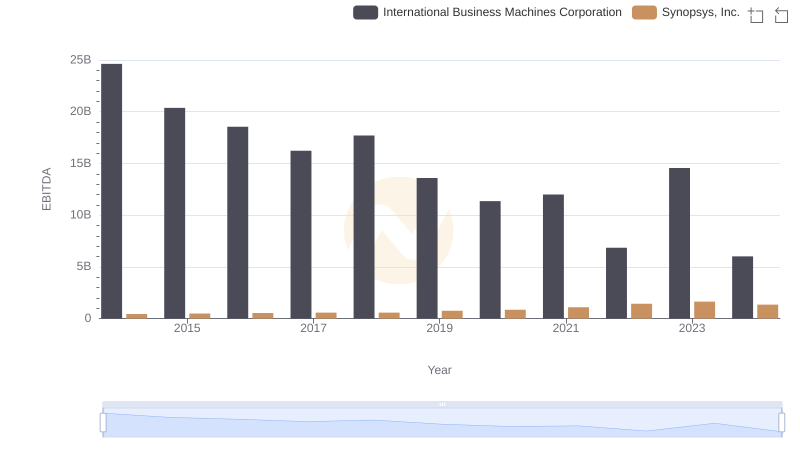
International Business Machines Corporation and Synopsys, Inc.: A Detailed Examination of EBITDA Performance
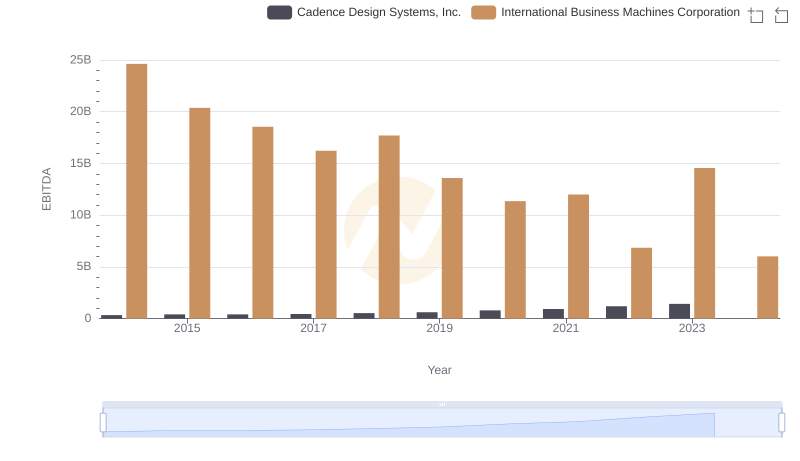
EBITDA Analysis: Evaluating International Business Machines Corporation Against Cadence Design Systems, Inc.