| __timestamp | International Business Machines Corporation | Lam Research Corporation |
|---|---|---|
| Wednesday, January 1, 2014 | 24962000000 | 977923000 |
| Thursday, January 1, 2015 | 20268000000 | 1155224000 |
| Friday, January 1, 2016 | 17341000000 | 1365284000 |
| Sunday, January 1, 2017 | 16556000000 | 2218837000 |
| Monday, January 1, 2018 | 16545000000 | 3539694000 |
| Tuesday, January 1, 2019 | 14609000000 | 2774013000 |
| Wednesday, January 1, 2020 | 10555000000 | 2942327000 |
| Friday, January 1, 2021 | 12409000000 | 4789174000 |
| Saturday, January 1, 2022 | 7174000000 | 5715561000 |
| Sunday, January 1, 2023 | 14693000000 | 5637608000 |
| Monday, January 1, 2024 | 6015000000 | 4905157000 |
Unveiling the hidden dimensions of data
In the ever-evolving landscape of technology, the financial health of industry giants like International Business Machines Corporation (IBM) and Lam Research Corporation is pivotal. Over the past decade, IBM's EBITDA has seen a significant decline, dropping from a peak in 2014 to nearly half by 2024. This represents a decrease of approximately 75%, highlighting the challenges faced by the company in adapting to new market dynamics.
Conversely, Lam Research has demonstrated a robust growth trajectory, with its EBITDA increasing nearly sixfold from 2014 to 2023. This growth underscores Lam's strategic positioning in the semiconductor industry, capitalizing on the surge in demand for advanced chip manufacturing technologies.
The contrasting EBITDA trends of these two companies offer a compelling narrative of adaptation and resilience in the face of technological advancements and market shifts. As we look to the future, these insights provide a valuable lens through which to assess the evolving tech landscape.
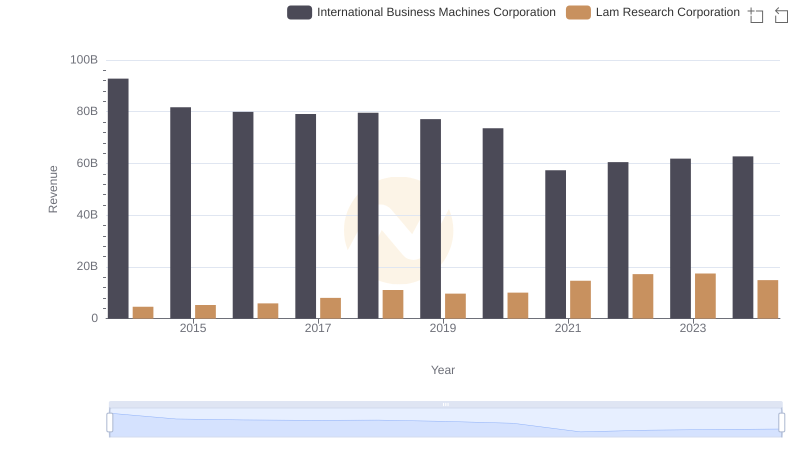
International Business Machines Corporation or Lam Research Corporation: Who Leads in Yearly Revenue?
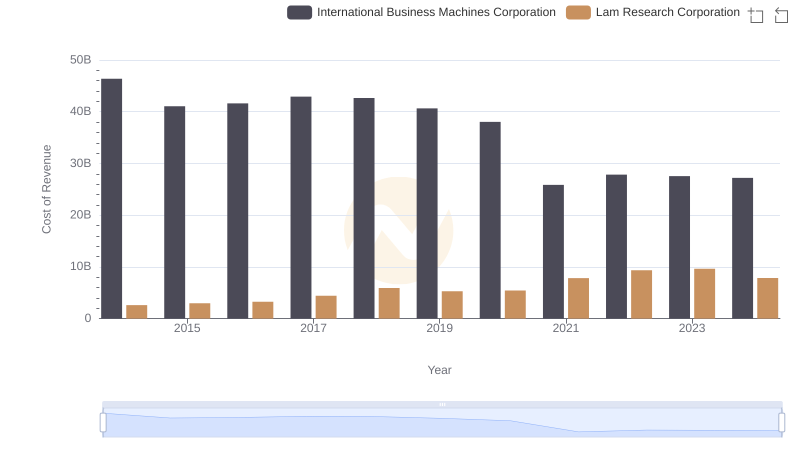
Analyzing Cost of Revenue: International Business Machines Corporation and Lam Research Corporation
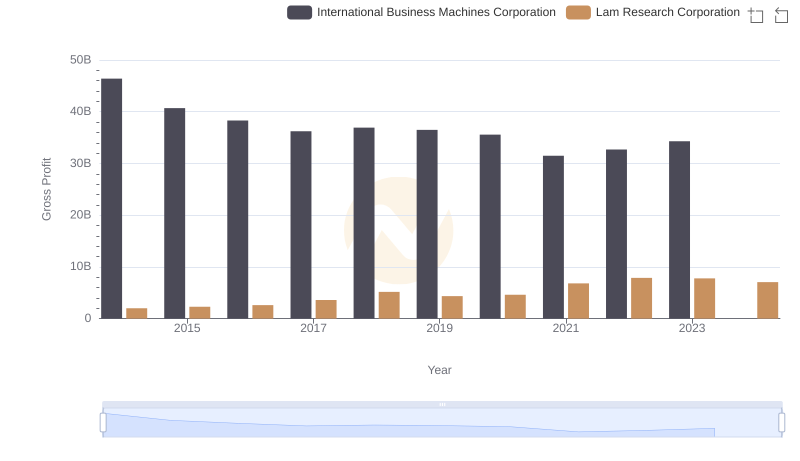
International Business Machines Corporation and Lam Research Corporation: A Detailed Gross Profit Analysis
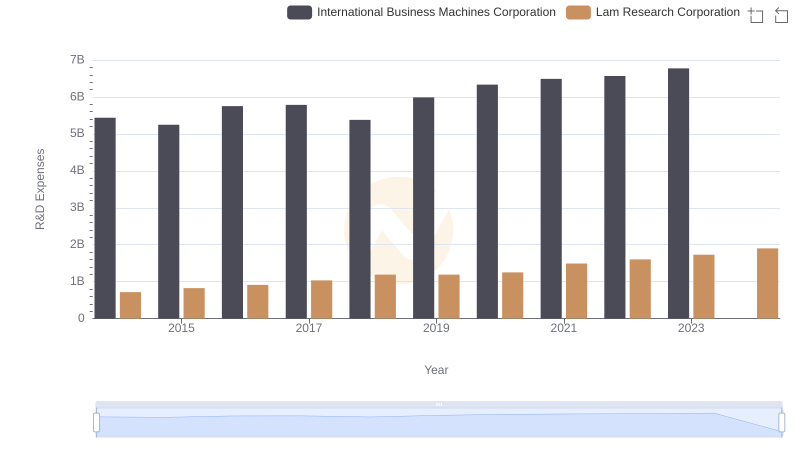
Research and Development Expenses Breakdown: International Business Machines Corporation vs Lam Research Corporation
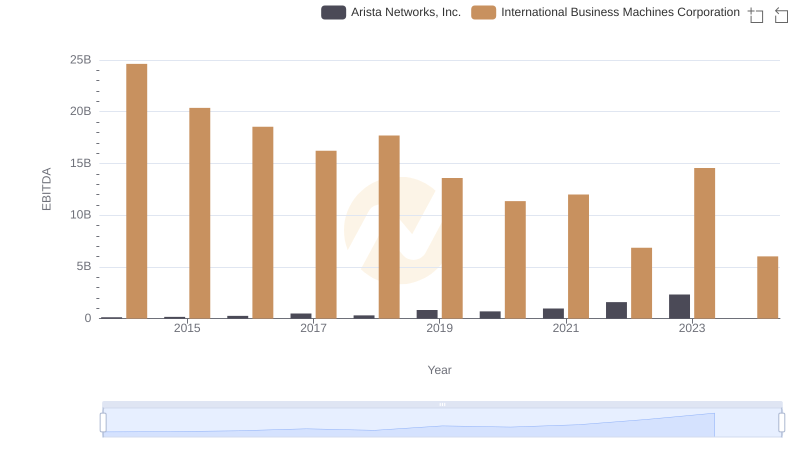
EBITDA Analysis: Evaluating International Business Machines Corporation Against Arista Networks, Inc.
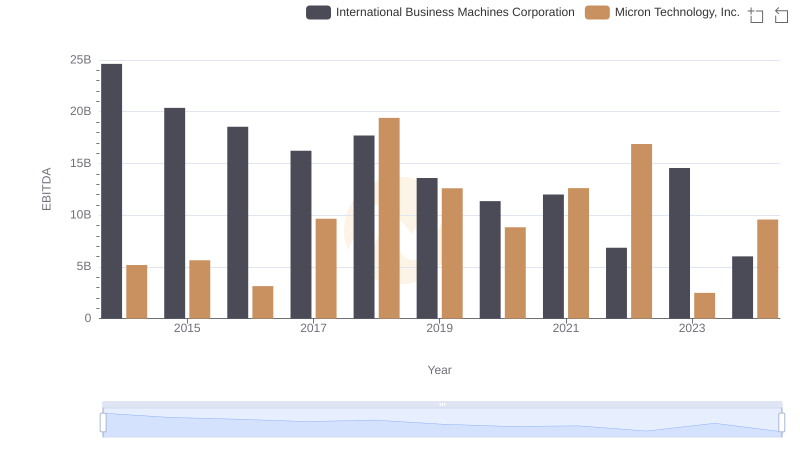
International Business Machines Corporation and Micron Technology, Inc.: A Detailed Examination of EBITDA Performance
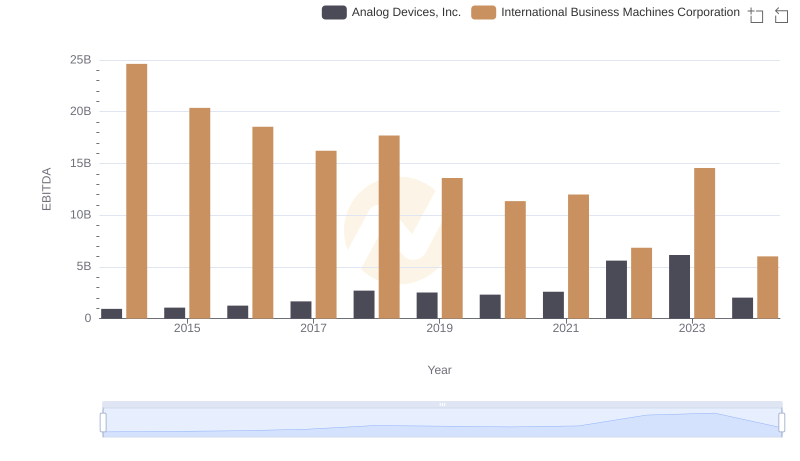
EBITDA Analysis: Evaluating International Business Machines Corporation Against Analog Devices, Inc.
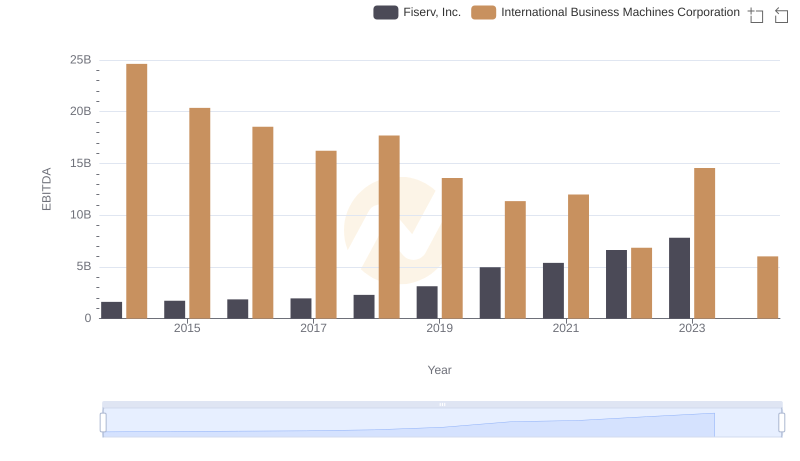
International Business Machines Corporation vs Fiserv, Inc.: In-Depth EBITDA Performance Comparison
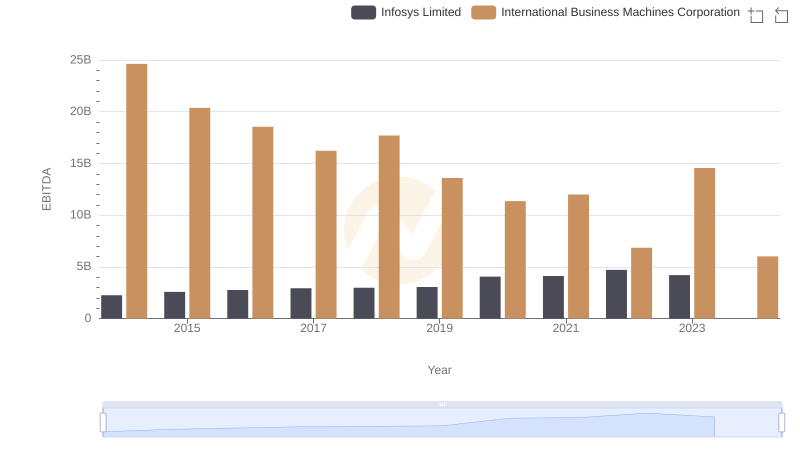
EBITDA Metrics Evaluated: International Business Machines Corporation vs Infosys Limited
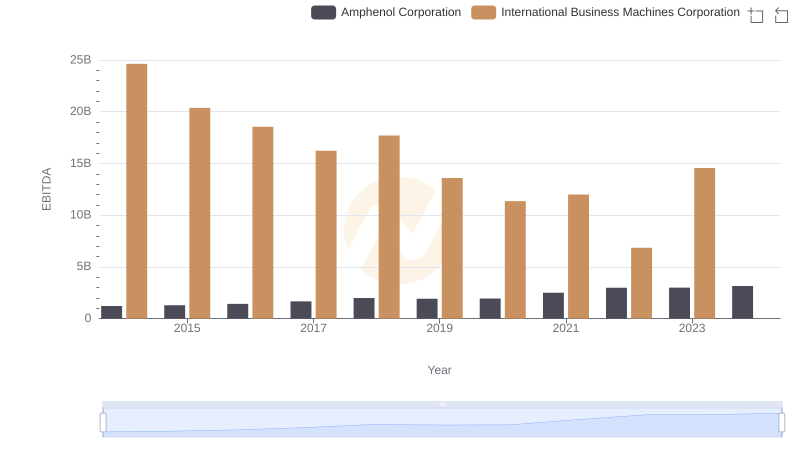
A Side-by-Side Analysis of EBITDA: International Business Machines Corporation and Amphenol Corporation