| __timestamp | Intel Corporation | International Business Machines Corporation |
|---|---|---|
| Wednesday, January 1, 2014 | 24191000000 | 24962000000 |
| Thursday, January 1, 2015 | 23067000000 | 20268000000 |
| Friday, January 1, 2016 | 22795000000 | 17341000000 |
| Sunday, January 1, 2017 | 26563000000 | 16556000000 |
| Monday, January 1, 2018 | 32329000000 | 16545000000 |
| Tuesday, January 1, 2019 | 33254000000 | 14609000000 |
| Wednesday, January 1, 2020 | 36115000000 | 10555000000 |
| Friday, January 1, 2021 | 33874000000 | 12409000000 |
| Saturday, January 1, 2022 | 15610000000 | 7174000000 |
| Sunday, January 1, 2023 | 11242000000 | 14693000000 |
| Monday, January 1, 2024 | 1203000000 | 6015000000 |
Infusing magic into the data realm
In the ever-evolving landscape of technology giants, the financial performance of International Business Machines Corporation (IBM) and Intel Corporation offers a fascinating glimpse into their strategic maneuvers over the past decade. From 2014 to 2023, Intel consistently outperformed IBM in terms of EBITDA, peaking in 2020 with a staggering 36% increase from its 2014 figures. IBM, on the other hand, experienced a more volatile journey, with its EBITDA dropping by approximately 41% from 2014 to 2022, before a slight recovery in 2023.
The data reveals a pivotal moment in 2018 when Intel's EBITDA surged by 22% compared to the previous year, while IBM's declined by 9%. This divergence highlights Intel's robust growth strategy, possibly driven by its focus on data-centric businesses. Meanwhile, IBM's fluctuating EBITDA underscores the challenges it faced in adapting to the rapidly changing tech environment. As we look to the future, the missing data for 2024 leaves us anticipating how these industry titans will navigate the next chapter.
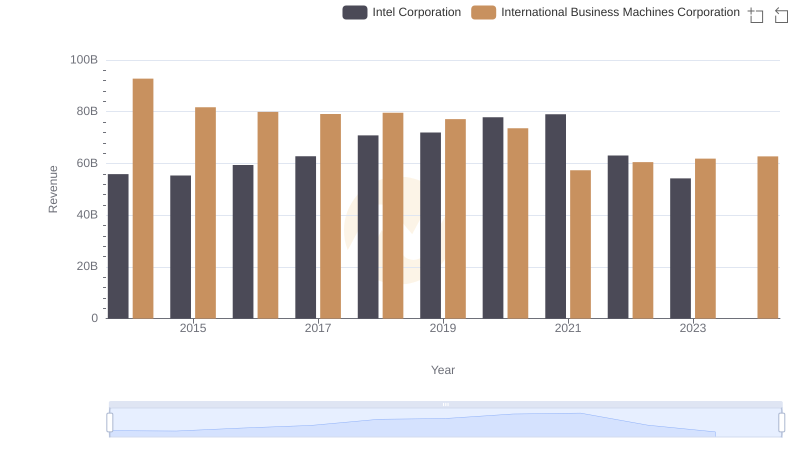
International Business Machines Corporation or Intel Corporation: Who Leads in Yearly Revenue?
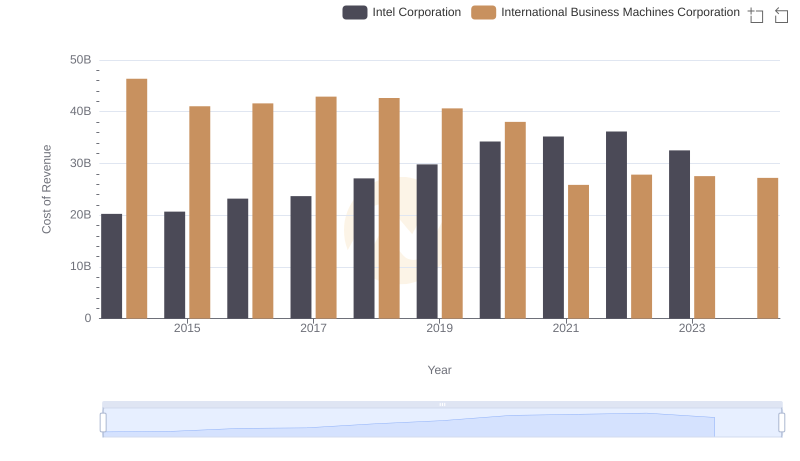
Cost Insights: Breaking Down International Business Machines Corporation and Intel Corporation's Expenses

Gross Profit Analysis: Comparing International Business Machines Corporation and Intel Corporation
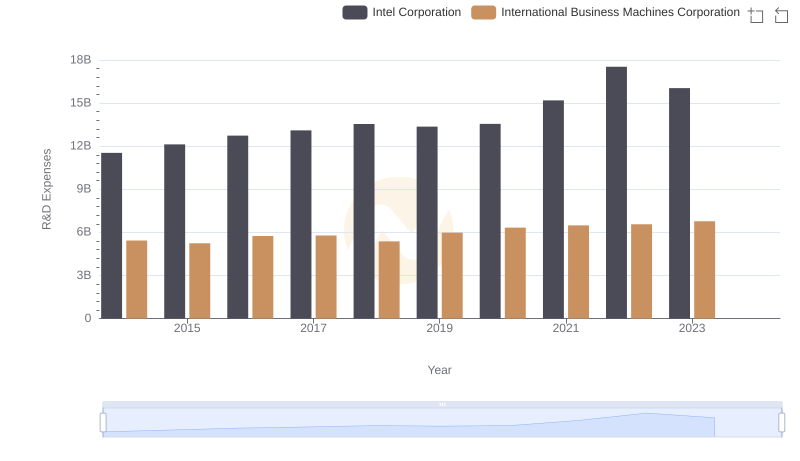
R&D Spending Showdown: International Business Machines Corporation vs Intel Corporation
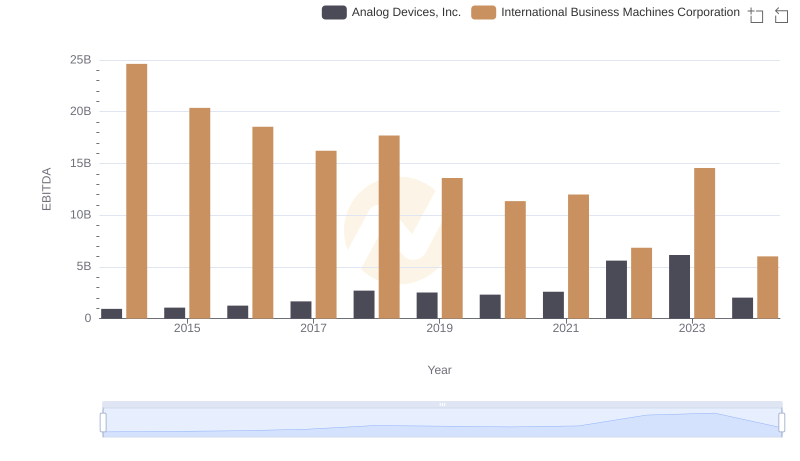
EBITDA Analysis: Evaluating International Business Machines Corporation Against Analog Devices, Inc.
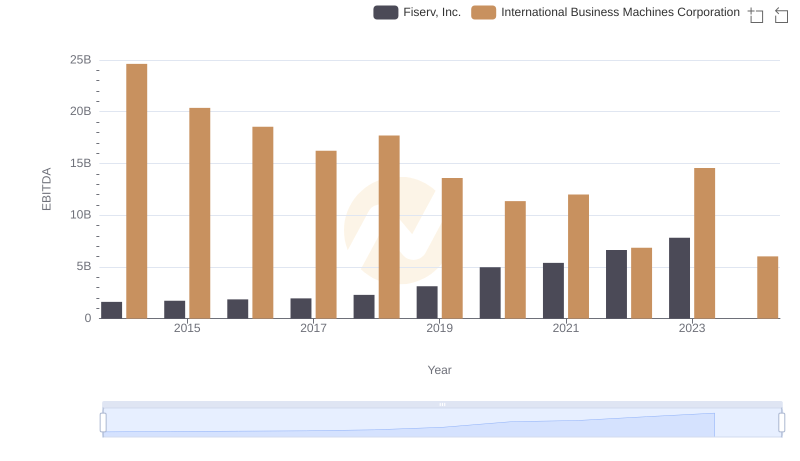
International Business Machines Corporation vs Fiserv, Inc.: In-Depth EBITDA Performance Comparison
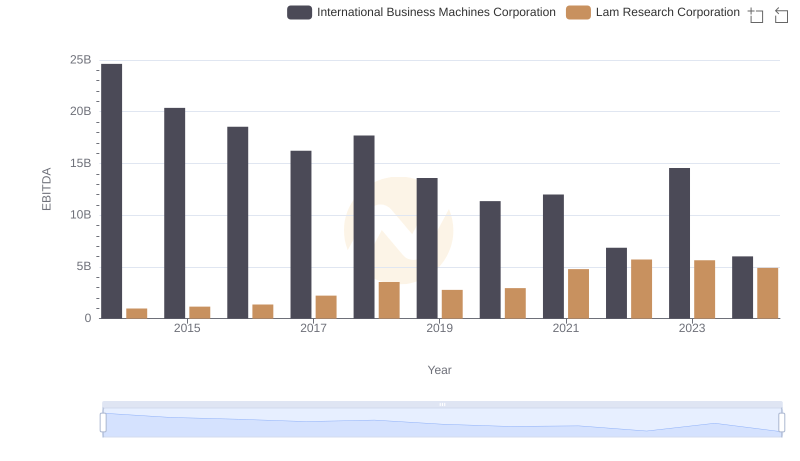
Professional EBITDA Benchmarking: International Business Machines Corporation vs Lam Research Corporation
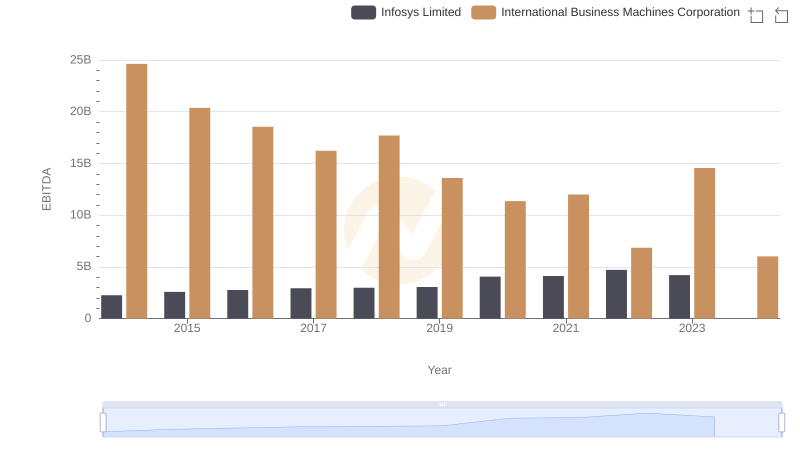
EBITDA Metrics Evaluated: International Business Machines Corporation vs Infosys Limited
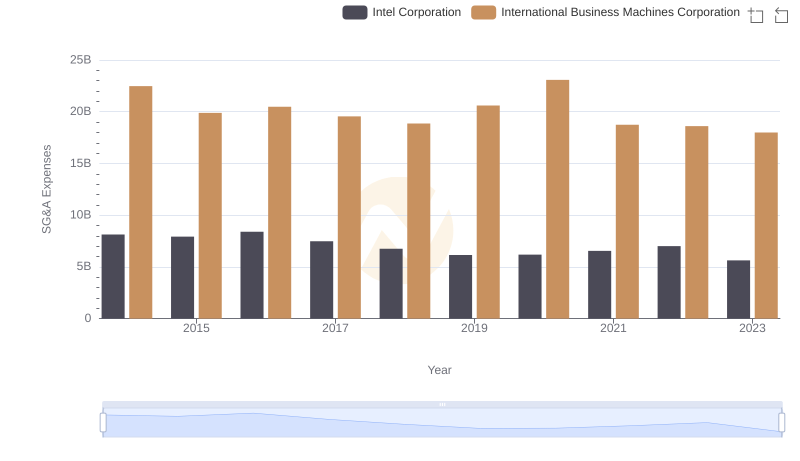
Selling, General, and Administrative Costs: International Business Machines Corporation vs Intel Corporation
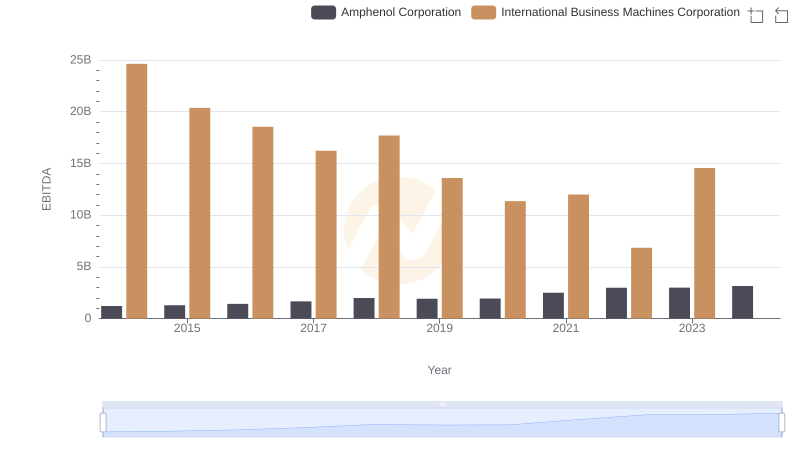
A Side-by-Side Analysis of EBITDA: International Business Machines Corporation and Amphenol Corporation
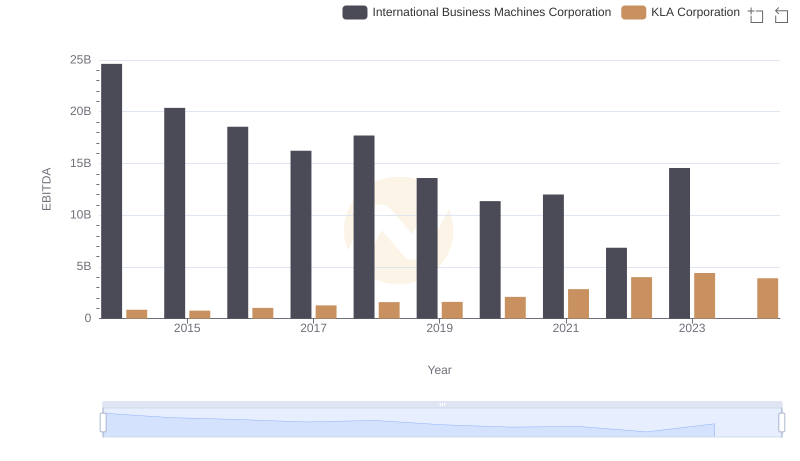
EBITDA Metrics Evaluated: International Business Machines Corporation vs KLA Corporation
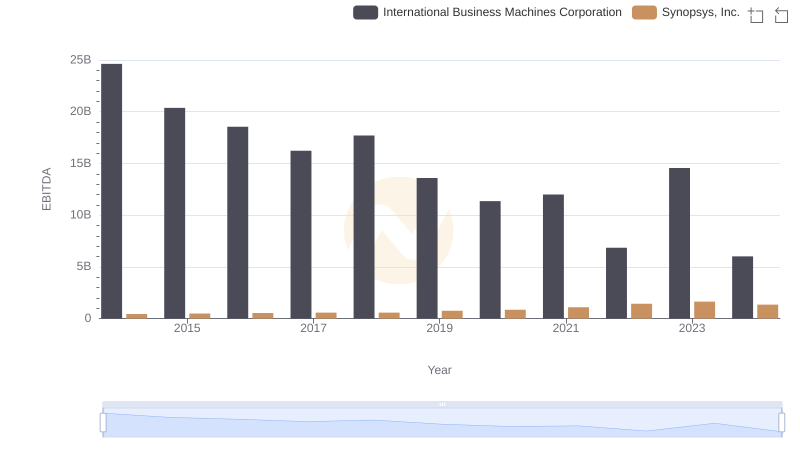
International Business Machines Corporation and Synopsys, Inc.: A Detailed Examination of EBITDA Performance