| __timestamp | International Business Machines Corporation | Synopsys, Inc. |
|---|---|---|
| Wednesday, January 1, 2014 | 24962000000 | 441543000 |
| Thursday, January 1, 2015 | 20268000000 | 496245000 |
| Friday, January 1, 2016 | 17341000000 | 540351000 |
| Sunday, January 1, 2017 | 16556000000 | 584909000 |
| Monday, January 1, 2018 | 16545000000 | 581213000 |
| Tuesday, January 1, 2019 | 14609000000 | 761347000 |
| Wednesday, January 1, 2020 | 10555000000 | 857403000 |
| Friday, January 1, 2021 | 12409000000 | 1101071000 |
| Saturday, January 1, 2022 | 7174000000 | 1435158000 |
| Sunday, January 1, 2023 | 14693000000 | 1647785000 |
| Monday, January 1, 2024 | 6015000000 | 1355711000 |
Unleashing insights
In the ever-evolving landscape of technology, the financial performance of industry leaders like International Business Machines Corporation (IBM) and Synopsys, Inc. offers a fascinating glimpse into their strategic maneuvers. Over the past decade, IBM's EBITDA has seen a significant decline, dropping from its peak in 2014 to nearly 60% less by 2024. This trend reflects IBM's ongoing transformation and adaptation to new market demands.
Conversely, Synopsys, a key player in electronic design automation, has demonstrated a robust growth trajectory. From 2014 to 2023, Synopsys' EBITDA has nearly quadrupled, showcasing its strategic positioning in the semiconductor industry. This stark contrast between the two companies highlights the dynamic nature of the tech sector, where innovation and adaptability are paramount.
As we delve into these financial narratives, it becomes evident that the future belongs to those who can pivot and innovate in response to market shifts.
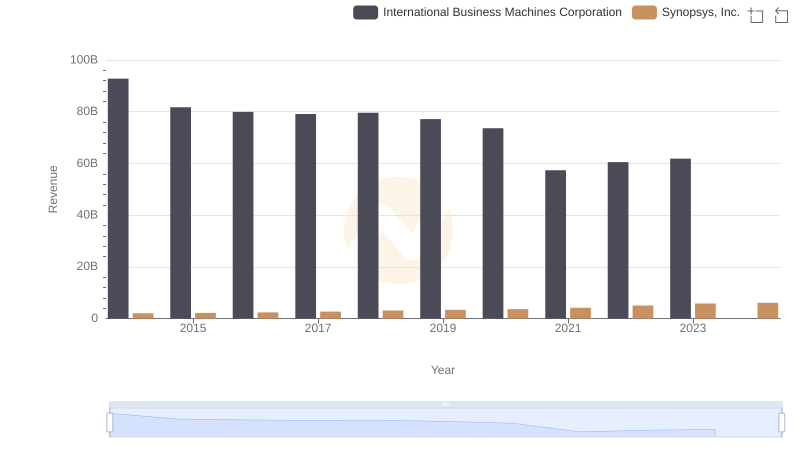
International Business Machines Corporation vs Synopsys, Inc.: Annual Revenue Growth Compared

Cost of Revenue Comparison: International Business Machines Corporation vs Synopsys, Inc.
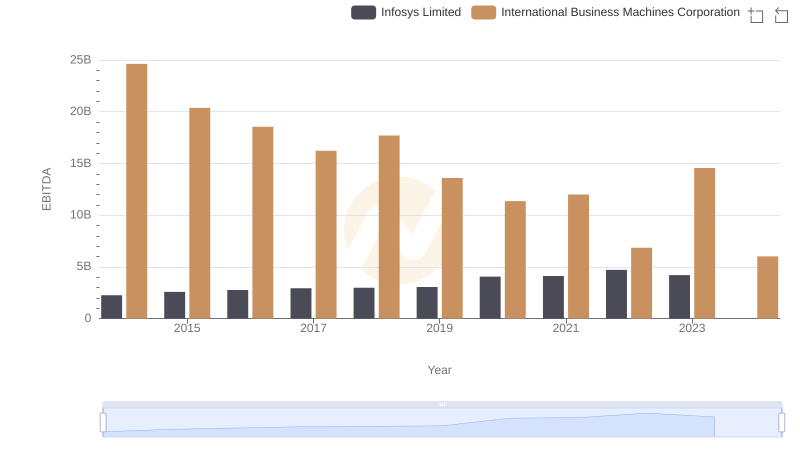
EBITDA Metrics Evaluated: International Business Machines Corporation vs Infosys Limited
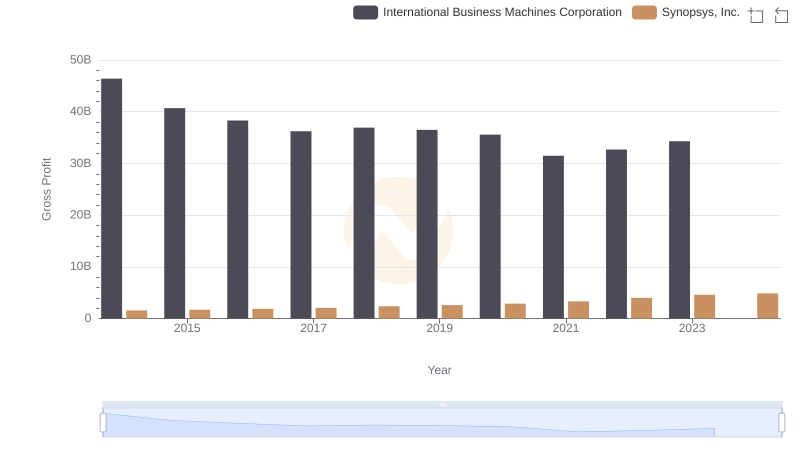
Key Insights on Gross Profit: International Business Machines Corporation vs Synopsys, Inc.
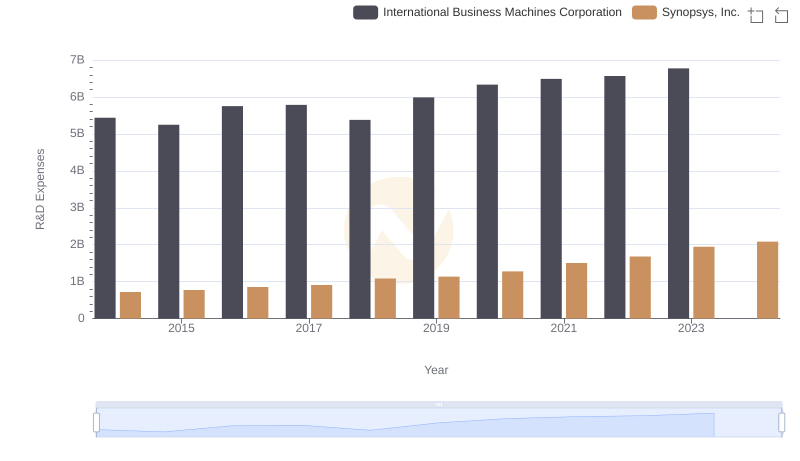
Who Prioritizes Innovation? R&D Spending Compared for International Business Machines Corporation and Synopsys, Inc.
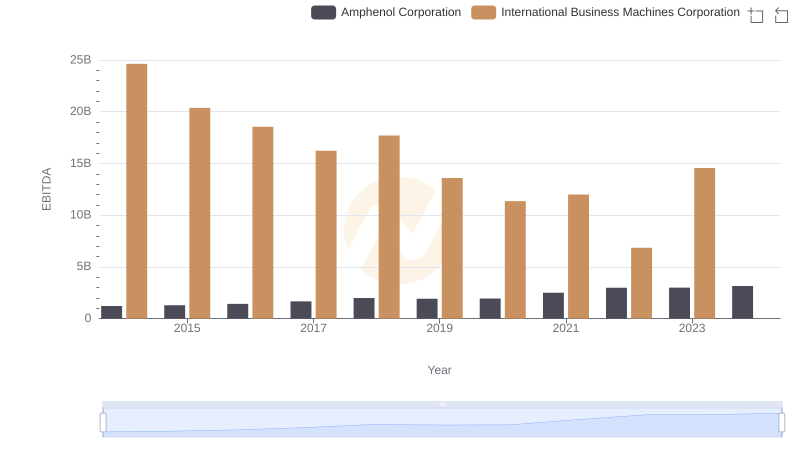
A Side-by-Side Analysis of EBITDA: International Business Machines Corporation and Amphenol Corporation
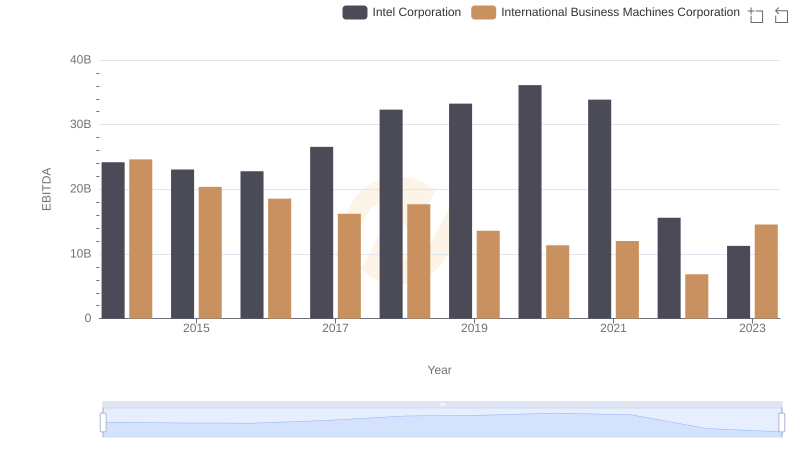
Comparative EBITDA Analysis: International Business Machines Corporation vs Intel Corporation
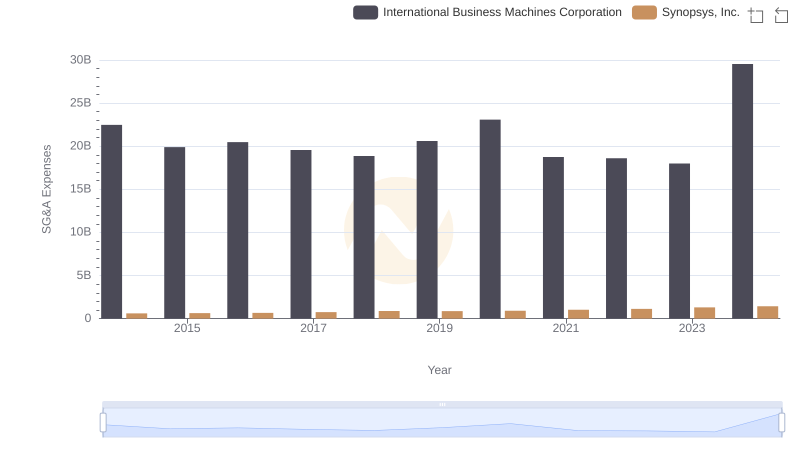
International Business Machines Corporation or Synopsys, Inc.: Who Manages SG&A Costs Better?
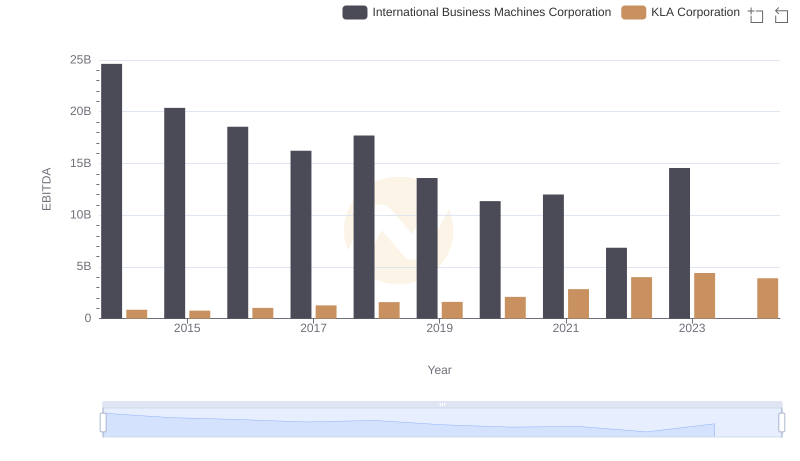
EBITDA Metrics Evaluated: International Business Machines Corporation vs KLA Corporation
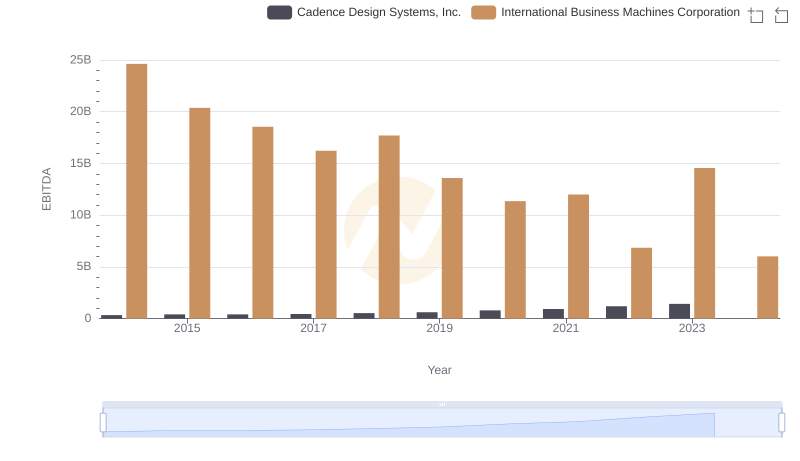
EBITDA Analysis: Evaluating International Business Machines Corporation Against Cadence Design Systems, Inc.
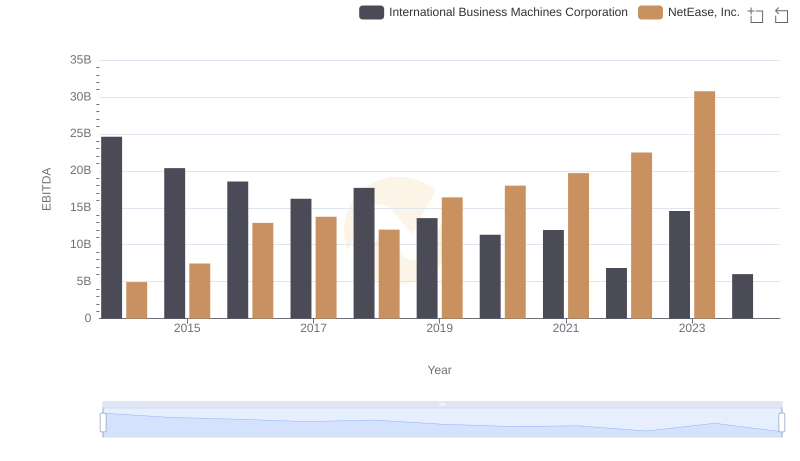
A Professional Review of EBITDA: International Business Machines Corporation Compared to NetEase, Inc.
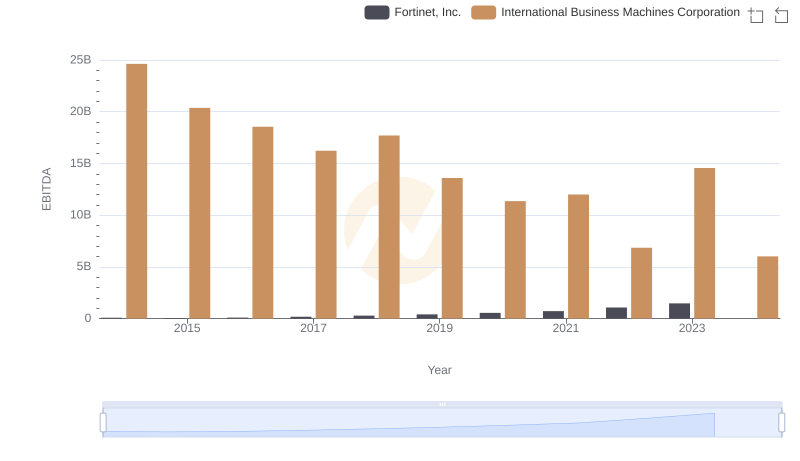
A Side-by-Side Analysis of EBITDA: International Business Machines Corporation and Fortinet, Inc.