| __timestamp | International Business Machines Corporation | KLA Corporation |
|---|---|---|
| Wednesday, January 1, 2014 | 22472000000 | 384907000 |
| Thursday, January 1, 2015 | 19894000000 | 406864000 |
| Friday, January 1, 2016 | 20279000000 | 379399000 |
| Sunday, January 1, 2017 | 19680000000 | 389336000 |
| Monday, January 1, 2018 | 19366000000 | 443426000 |
| Tuesday, January 1, 2019 | 18724000000 | 599124000 |
| Wednesday, January 1, 2020 | 20561000000 | 734149000 |
| Friday, January 1, 2021 | 18745000000 | 729602000 |
| Saturday, January 1, 2022 | 17483000000 | 860007000 |
| Sunday, January 1, 2023 | 17997000000 | 986326000 |
| Monday, January 1, 2024 | 29536000000 | 969509000 |
Unleashing insights
In the ever-evolving landscape of technology, understanding the financial strategies of industry leaders is crucial. This chart provides a fascinating glimpse into the Selling, General, and Administrative (SG&A) expenses of two tech titans: International Business Machines Corporation (IBM) and KLA Corporation, from 2014 to 2024.
IBM, a stalwart in the tech industry, consistently reported SG&A expenses that dwarf those of KLA, reflecting its expansive global operations. In 2023, IBM's SG&A costs were approximately 18 billion USD, a significant decrease from its peak in 2014. However, 2024 saw a dramatic rise to nearly 30 billion USD, indicating a strategic shift or investment.
Conversely, KLA, a leader in semiconductor manufacturing, maintained a more modest SG&A profile, with expenses growing steadily from 380 million USD in 2014 to nearly 970 million USD in 2024. This growth underscores KLA's expanding market presence and operational efficiency.
This comparative analysis highlights the contrasting financial strategies of these two corporations, offering insights into their operational priorities and market positioning.
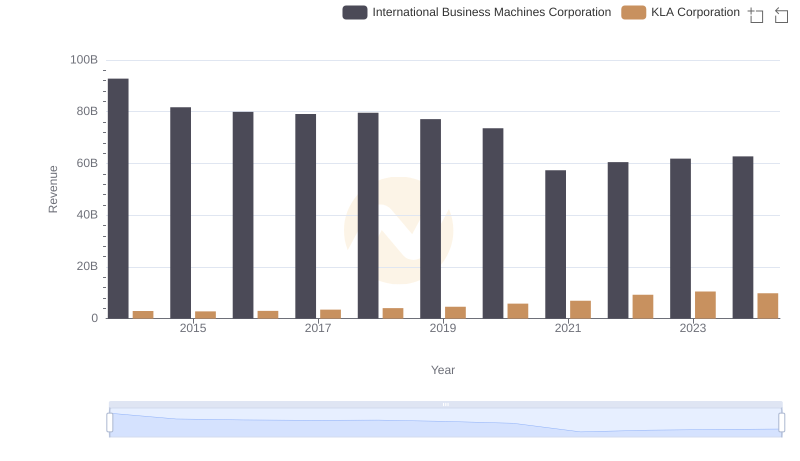
Breaking Down Revenue Trends: International Business Machines Corporation vs KLA Corporation
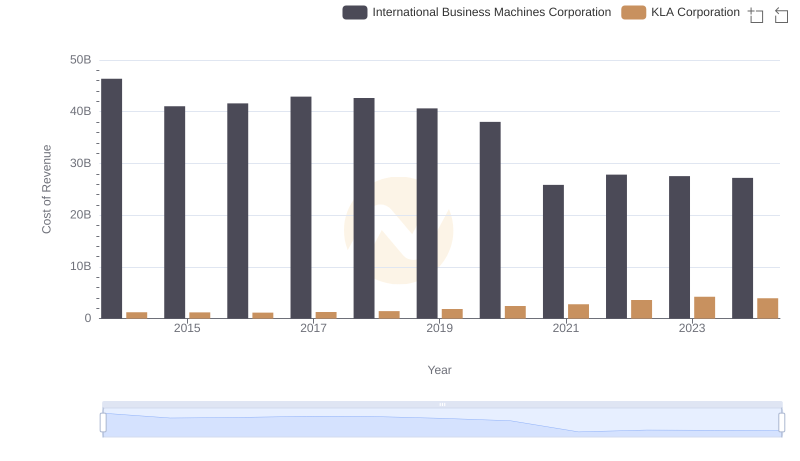
Cost Insights: Breaking Down International Business Machines Corporation and KLA Corporation's Expenses
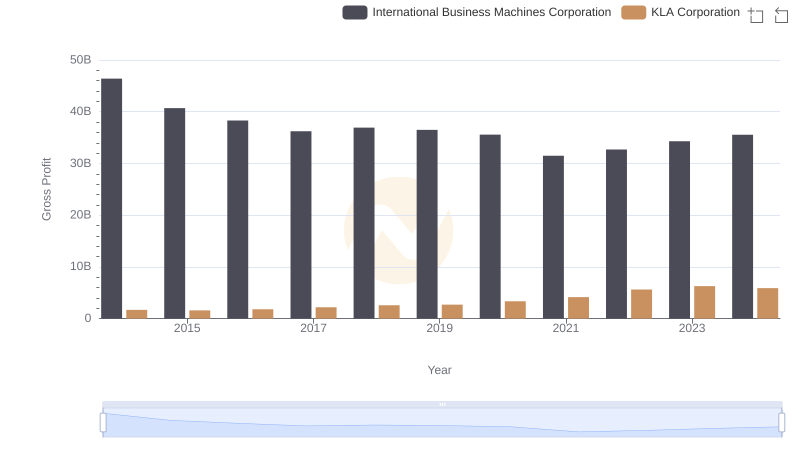
International Business Machines Corporation vs KLA Corporation: A Gross Profit Performance Breakdown
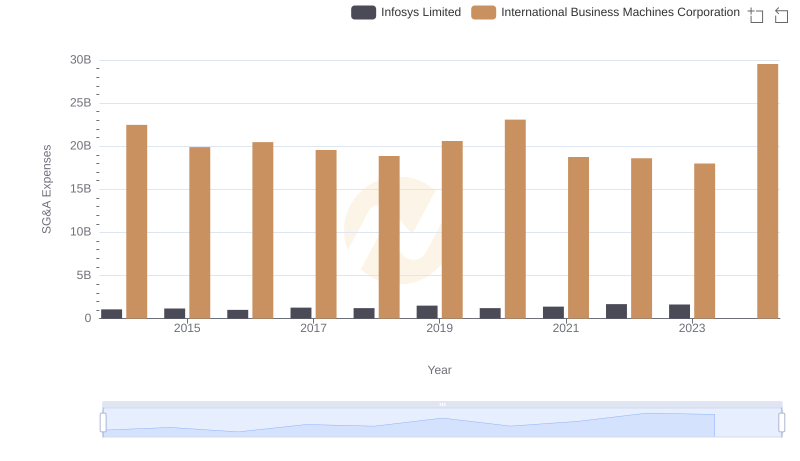
SG&A Efficiency Analysis: Comparing International Business Machines Corporation and Infosys Limited
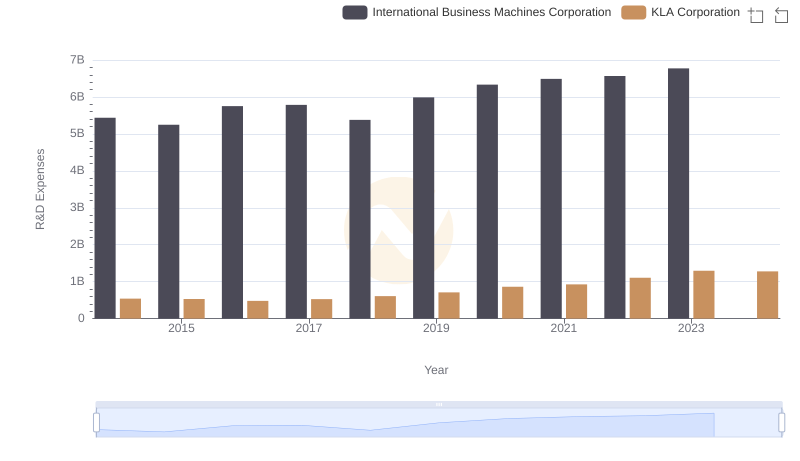
Analyzing R&D Budgets: International Business Machines Corporation vs KLA Corporation
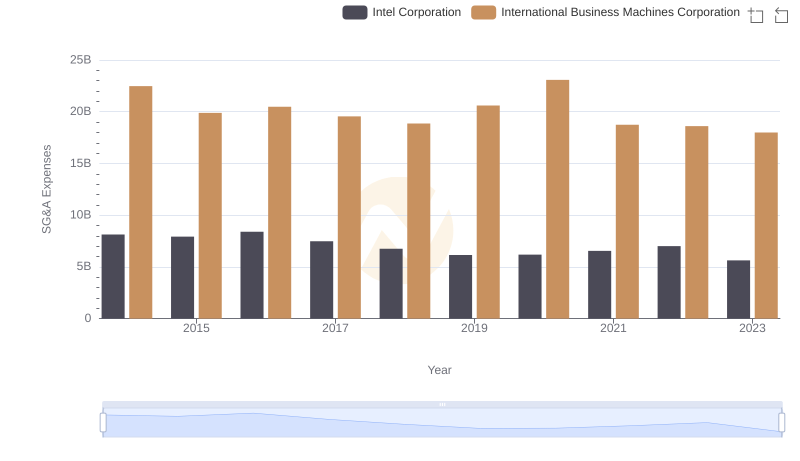
Selling, General, and Administrative Costs: International Business Machines Corporation vs Intel Corporation
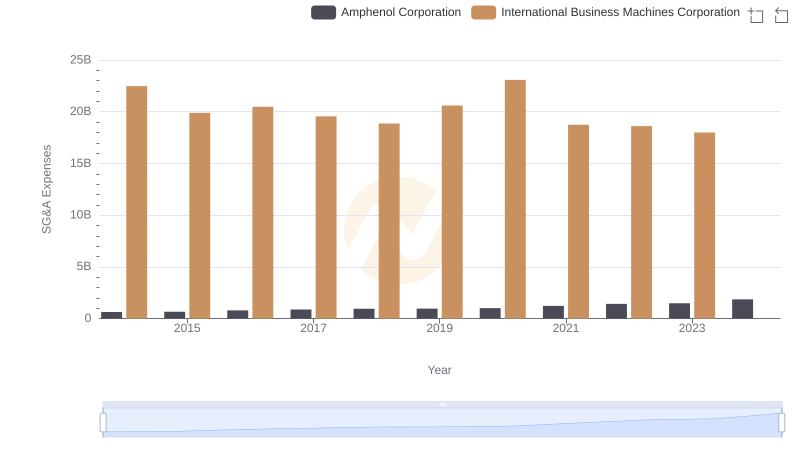
International Business Machines Corporation or Amphenol Corporation: Who Manages SG&A Costs Better?
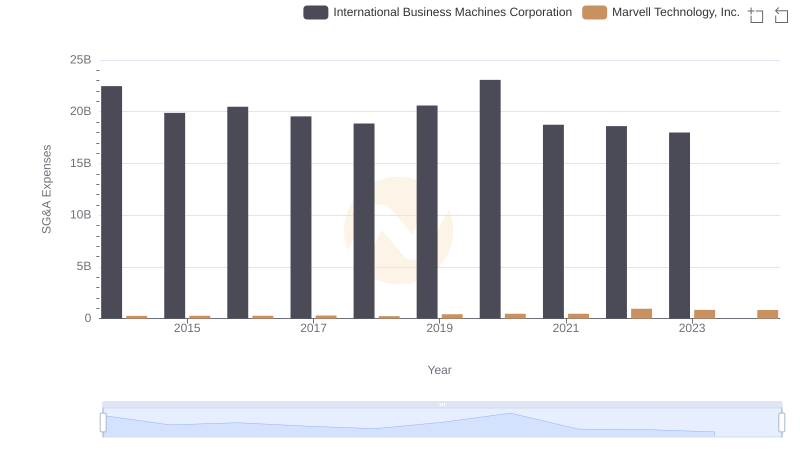
SG&A Efficiency Analysis: Comparing International Business Machines Corporation and Marvell Technology, Inc.
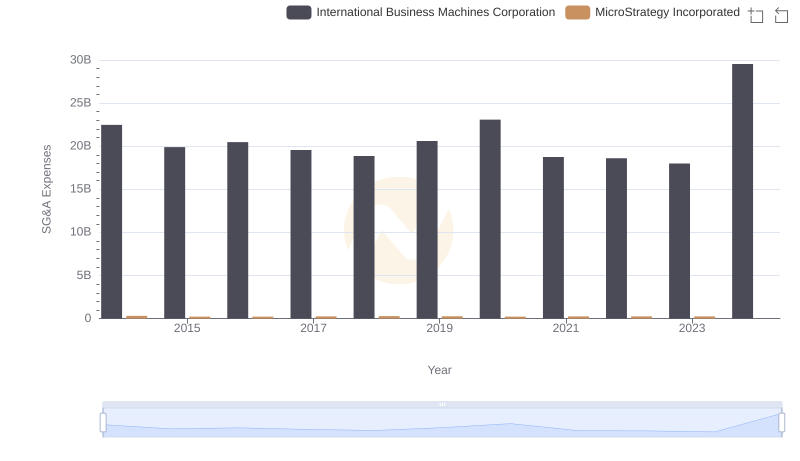
International Business Machines Corporation or MicroStrategy Incorporated: Who Manages SG&A Costs Better?
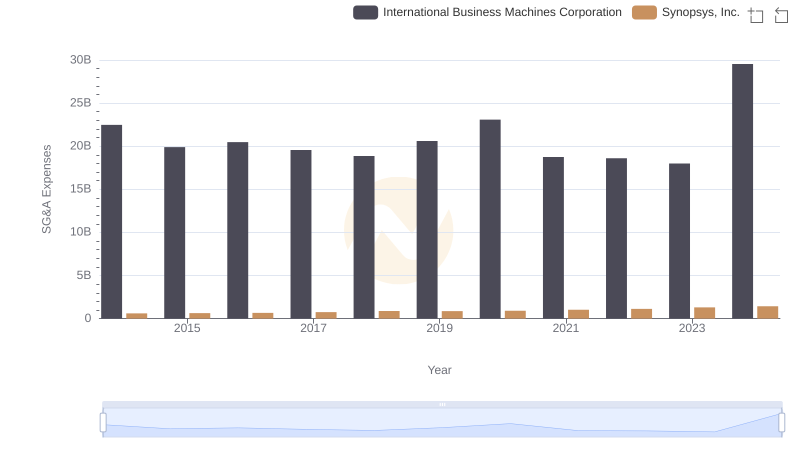
International Business Machines Corporation or Synopsys, Inc.: Who Manages SG&A Costs Better?
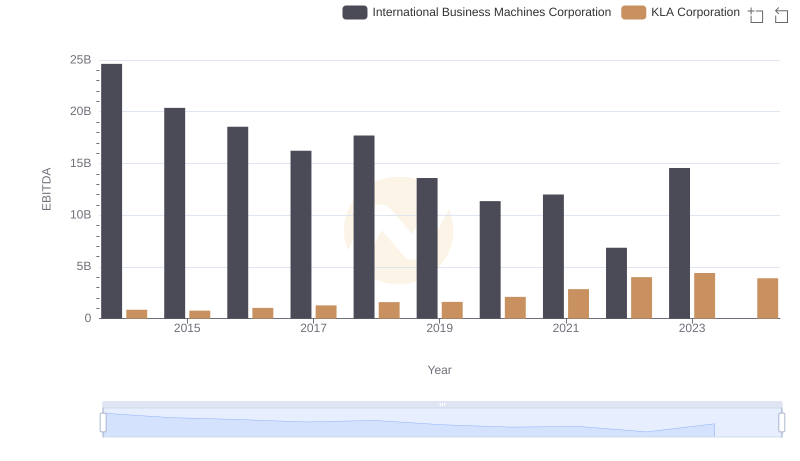
EBITDA Metrics Evaluated: International Business Machines Corporation vs KLA Corporation
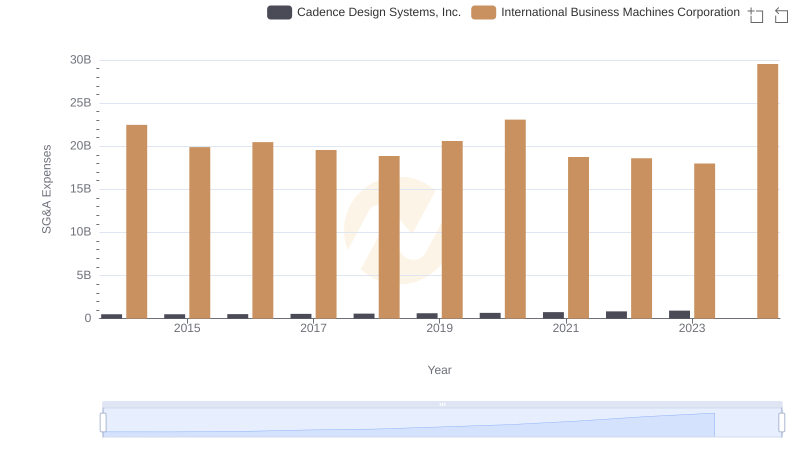
Cost Management Insights: SG&A Expenses for International Business Machines Corporation and Cadence Design Systems, Inc.