| __timestamp | Infosys Limited | International Business Machines Corporation |
|---|---|---|
| Wednesday, January 1, 2014 | 2258000000 | 24962000000 |
| Thursday, January 1, 2015 | 2590000000 | 20268000000 |
| Friday, January 1, 2016 | 2765000000 | 17341000000 |
| Sunday, January 1, 2017 | 2936000000 | 16556000000 |
| Monday, January 1, 2018 | 2984000000 | 16545000000 |
| Tuesday, January 1, 2019 | 3053000000 | 14609000000 |
| Wednesday, January 1, 2020 | 4053342784 | 10555000000 |
| Friday, January 1, 2021 | 4116000000 | 12409000000 |
| Saturday, January 1, 2022 | 4707334610 | 7174000000 |
| Sunday, January 1, 2023 | 4206000000 | 14693000000 |
| Monday, January 1, 2024 | 6015000000 |
Unleashing insights
In the ever-evolving landscape of global technology, International Business Machines Corporation (IBM) and Infosys Limited stand as titans. From 2014 to 2023, these companies have showcased contrasting EBITDA trajectories. IBM, a stalwart in the tech industry, saw its EBITDA peak in 2014, only to experience a gradual decline, reaching a low in 2022. However, a resurgence in 2023 marked a 112% increase from the previous year. Meanwhile, Infosys demonstrated a steady climb, with its EBITDA growing by approximately 86% over the same period, peaking in 2022. This growth underscores Infosys's resilience and adaptability in a competitive market. The data for 2024 remains incomplete, leaving room for speculation on future trends. As these companies continue to innovate, their financial performances offer a fascinating glimpse into the strategies that drive success in the tech world.
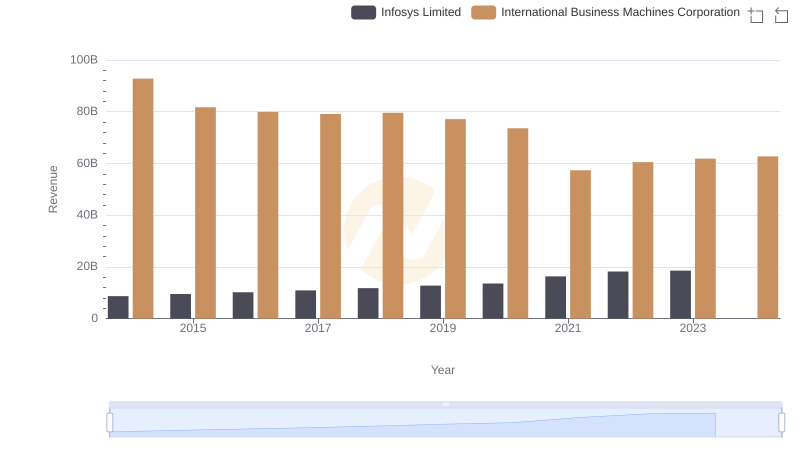
Revenue Insights: International Business Machines Corporation and Infosys Limited Performance Compared
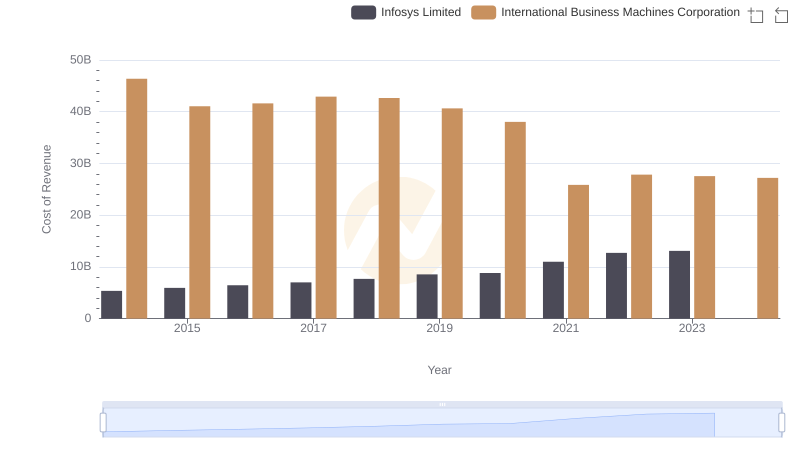
International Business Machines Corporation vs Infosys Limited: Efficiency in Cost of Revenue Explored
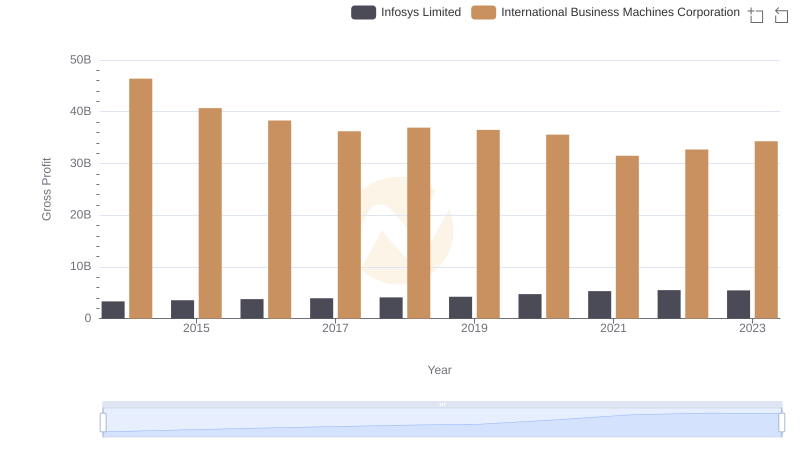
Key Insights on Gross Profit: International Business Machines Corporation vs Infosys Limited
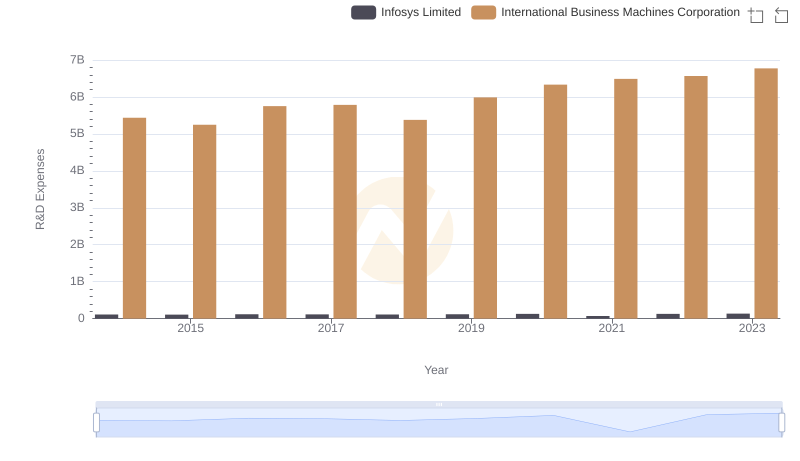
Analyzing R&D Budgets: International Business Machines Corporation vs Infosys Limited
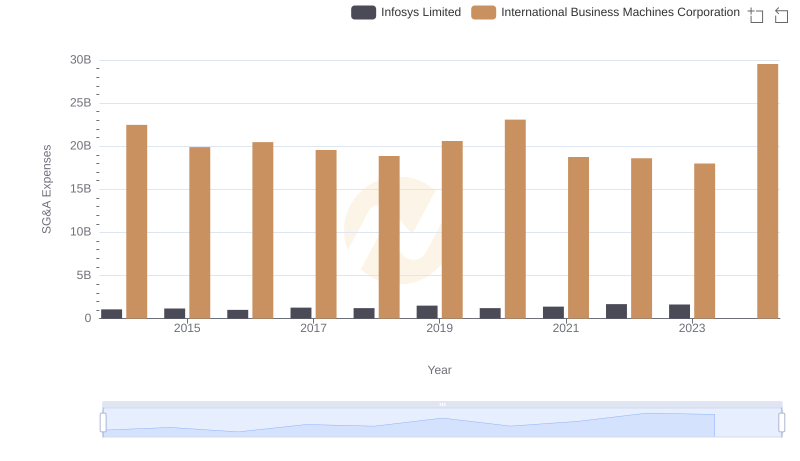
SG&A Efficiency Analysis: Comparing International Business Machines Corporation and Infosys Limited
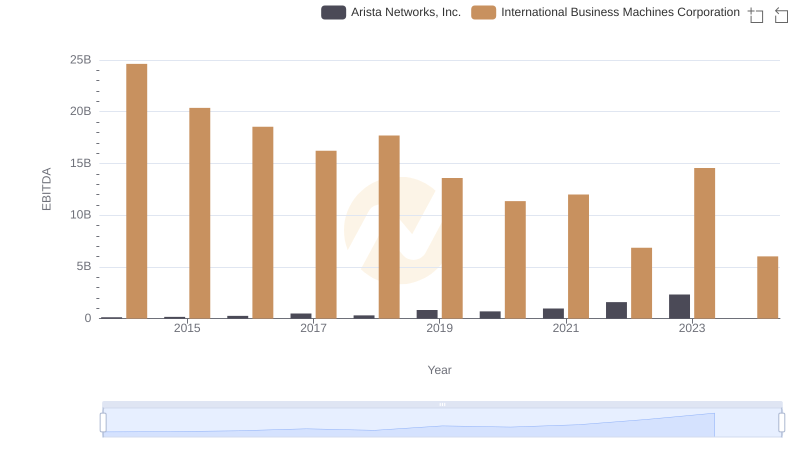
EBITDA Analysis: Evaluating International Business Machines Corporation Against Arista Networks, Inc.
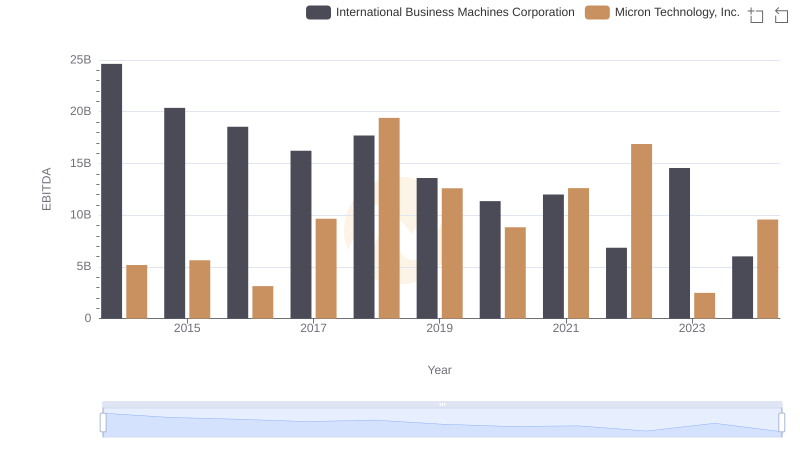
International Business Machines Corporation and Micron Technology, Inc.: A Detailed Examination of EBITDA Performance
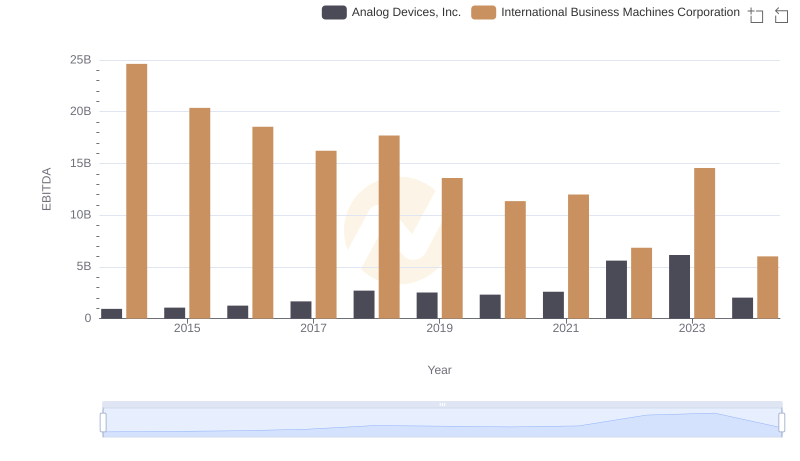
EBITDA Analysis: Evaluating International Business Machines Corporation Against Analog Devices, Inc.
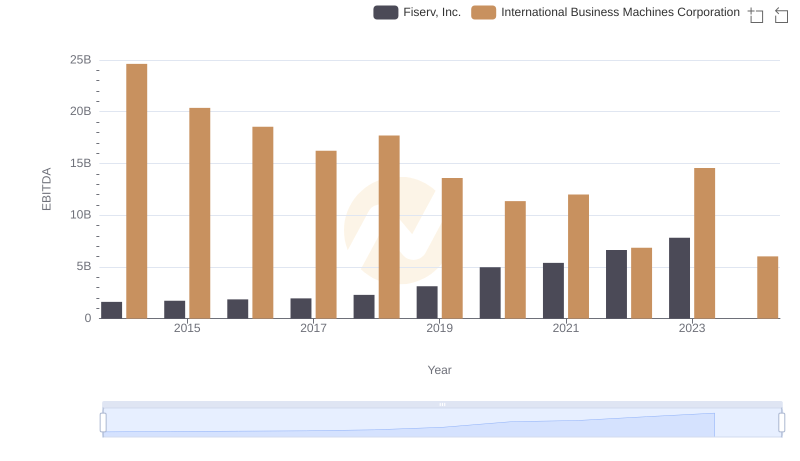
International Business Machines Corporation vs Fiserv, Inc.: In-Depth EBITDA Performance Comparison
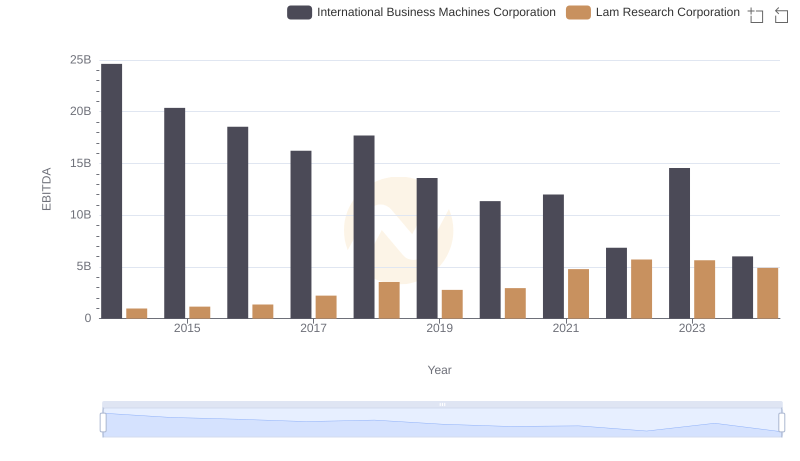
Professional EBITDA Benchmarking: International Business Machines Corporation vs Lam Research Corporation
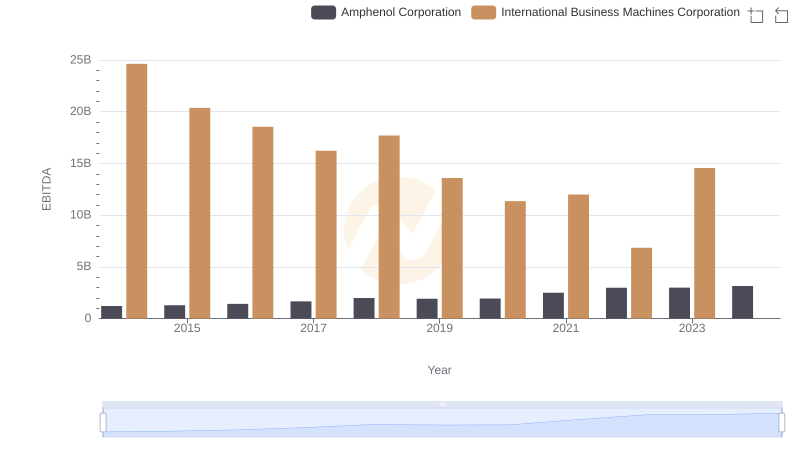
A Side-by-Side Analysis of EBITDA: International Business Machines Corporation and Amphenol Corporation