| __timestamp | International Business Machines Corporation | KLA Corporation |
|---|---|---|
| Wednesday, January 1, 2014 | 46407000000 | 1696446000 |
| Thursday, January 1, 2015 | 40684000000 | 1598820000 |
| Friday, January 1, 2016 | 38516000000 | 1821102000 |
| Sunday, January 1, 2017 | 36943000000 | 2192467000 |
| Monday, January 1, 2018 | 36936000000 | 2589332000 |
| Tuesday, January 1, 2019 | 31533000000 | 2699527000 |
| Wednesday, January 1, 2020 | 30865000000 | 3356863000 |
| Friday, January 1, 2021 | 31486000000 | 4146569000 |
| Saturday, January 1, 2022 | 32687000000 | 5619442000 |
| Sunday, January 1, 2023 | 34300000000 | 6277749000 |
| Monday, January 1, 2024 | 35551000000 | 5884174000 |
Unlocking the unknown
In the ever-evolving landscape of technology, the financial performance of industry giants like International Business Machines Corporation (IBM) and KLA Corporation offers a fascinating glimpse into their strategic maneuvers. Over the past decade, IBM's gross profit has seen a decline of approximately 24%, from its peak in 2014 to 2024. This trend reflects the company's ongoing transformation and adaptation to new market demands.
Conversely, KLA Corporation has demonstrated a robust growth trajectory, with its gross profit surging by nearly 250% over the same period. This impressive increase underscores KLA's strategic focus on semiconductor manufacturing solutions, a sector experiencing rapid expansion.
The contrasting financial paths of these two corporations highlight the dynamic nature of the tech industry. As IBM continues to reinvent itself, KLA's growth story serves as a testament to the opportunities within the semiconductor space.
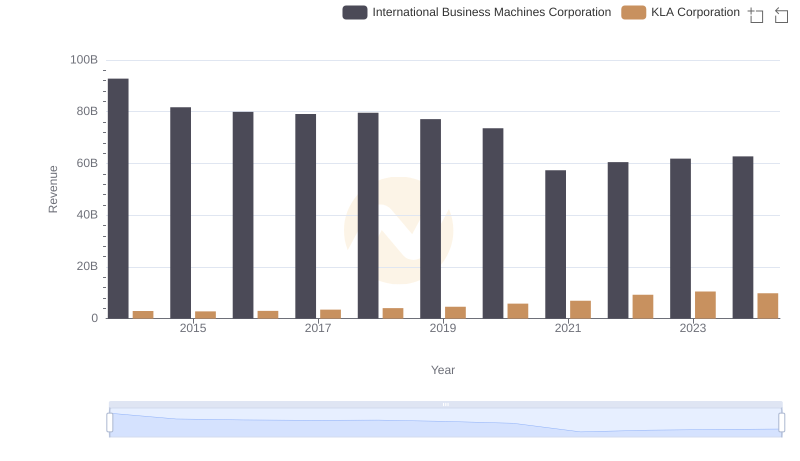
Breaking Down Revenue Trends: International Business Machines Corporation vs KLA Corporation
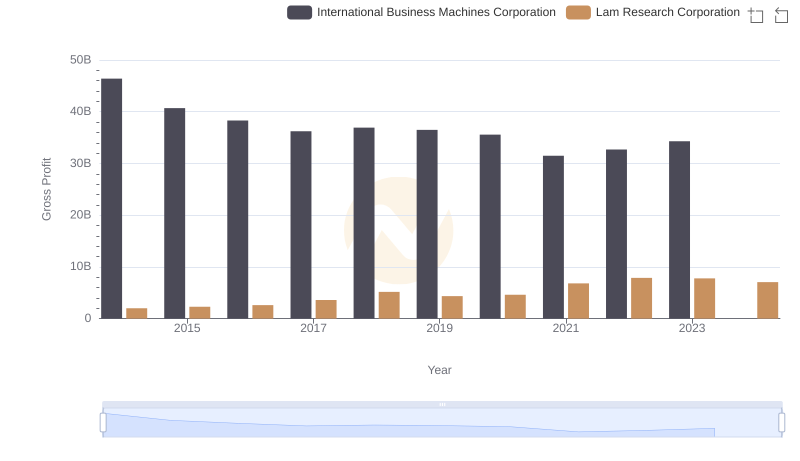
International Business Machines Corporation and Lam Research Corporation: A Detailed Gross Profit Analysis
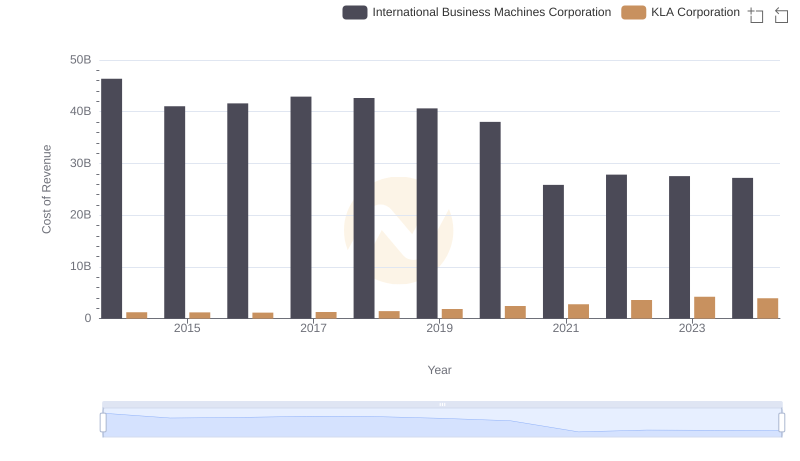
Cost Insights: Breaking Down International Business Machines Corporation and KLA Corporation's Expenses
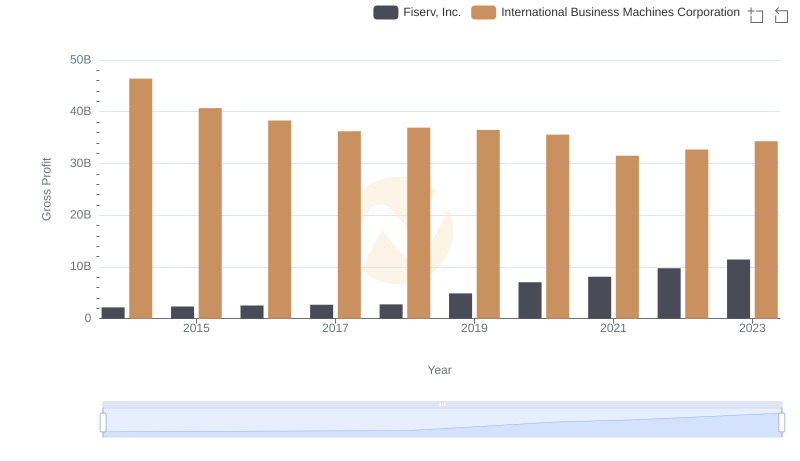
Key Insights on Gross Profit: International Business Machines Corporation vs Fiserv, Inc.
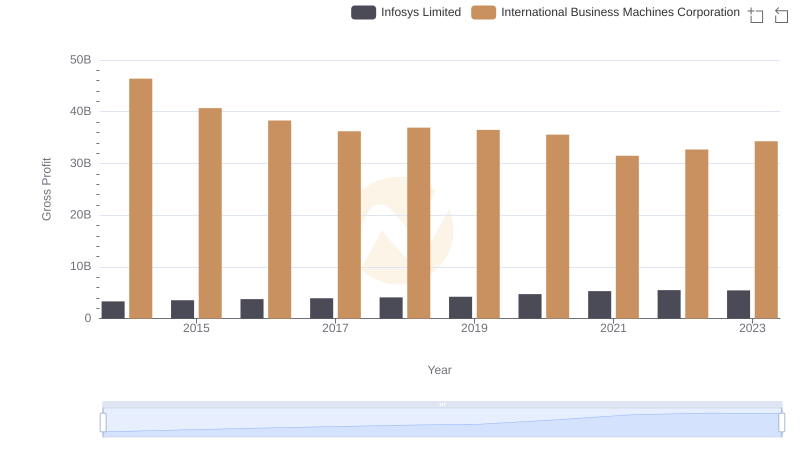
Key Insights on Gross Profit: International Business Machines Corporation vs Infosys Limited

Gross Profit Analysis: Comparing International Business Machines Corporation and Intel Corporation
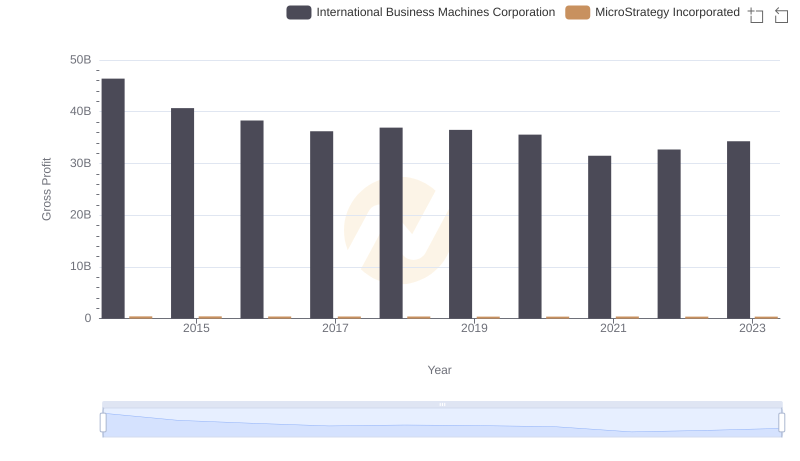
International Business Machines Corporation vs MicroStrategy Incorporated: A Gross Profit Performance Breakdown

Gross Profit Trends Compared: International Business Machines Corporation vs Marvell Technology, Inc.
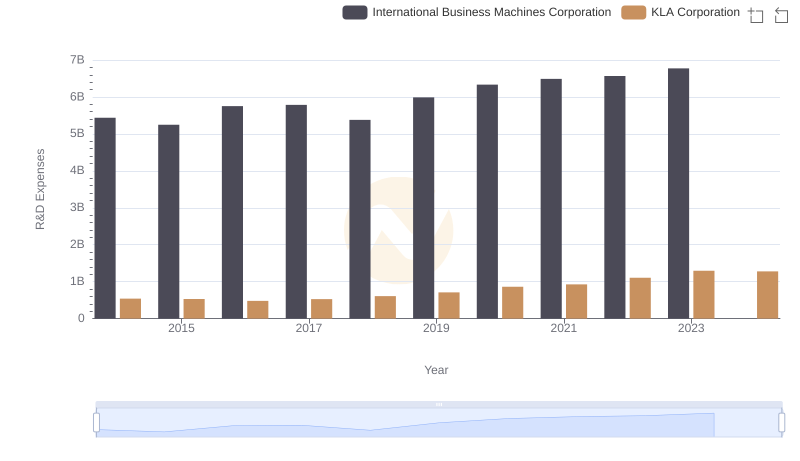
Analyzing R&D Budgets: International Business Machines Corporation vs KLA Corporation
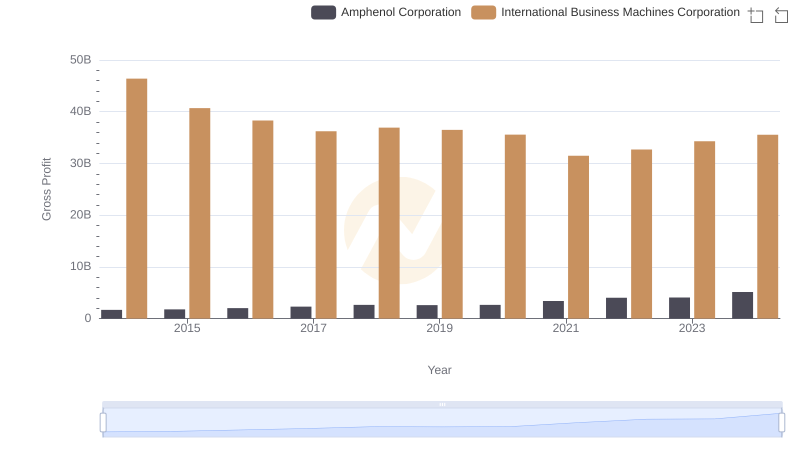
Who Generates Higher Gross Profit? International Business Machines Corporation or Amphenol Corporation
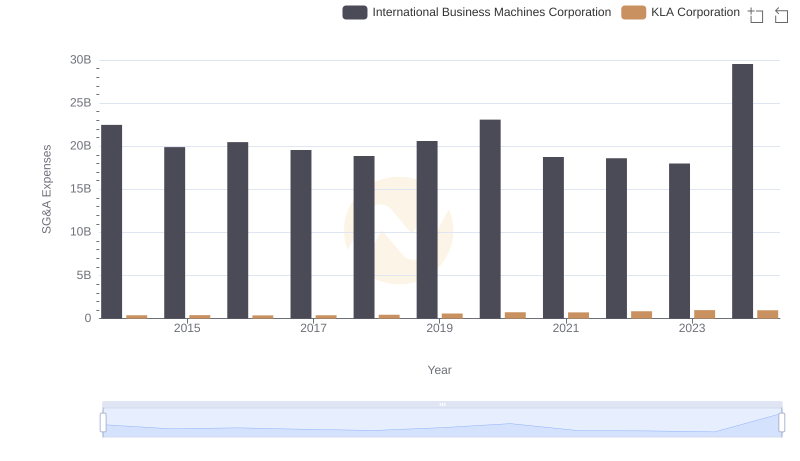
Selling, General, and Administrative Costs: International Business Machines Corporation vs KLA Corporation
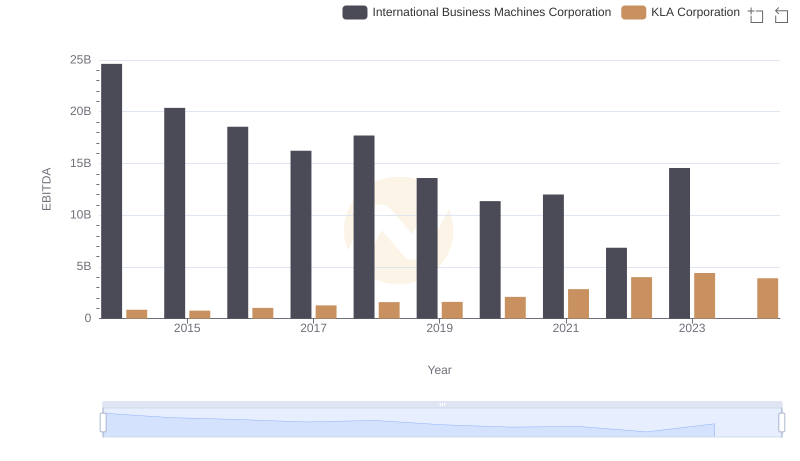
EBITDA Metrics Evaluated: International Business Machines Corporation vs KLA Corporation