| __timestamp | Corning Incorporated | International Business Machines Corporation |
|---|---|---|
| Wednesday, January 1, 2014 | 3046000000 | 24962000000 |
| Thursday, January 1, 2015 | 2517000000 | 20268000000 |
| Friday, January 1, 2016 | 2640000000 | 17341000000 |
| Sunday, January 1, 2017 | 2766000000 | 16556000000 |
| Monday, January 1, 2018 | 2897000000 | 16545000000 |
| Tuesday, January 1, 2019 | 3163000000 | 14609000000 |
| Wednesday, January 1, 2020 | 2865000000 | 10555000000 |
| Friday, January 1, 2021 | 3774000000 | 12409000000 |
| Saturday, January 1, 2022 | 3357000000 | 7174000000 |
| Sunday, January 1, 2023 | 2514000000 | 14693000000 |
| Monday, January 1, 2024 | 2492000000 | 6015000000 |
Cracking the code
In the ever-evolving landscape of technology and innovation, two giants, International Business Machines Corporation (IBM) and Corning Incorporated, have showcased contrasting financial trajectories over the past decade. From 2014 to 2024, IBM's EBITDA has seen a significant decline of approximately 76%, dropping from a peak in 2014 to a low in 2024. This trend reflects the challenges faced by IBM in adapting to the rapidly changing tech environment.
Conversely, Corning Incorporated, known for its innovations in glass and ceramics, has demonstrated resilience. Despite fluctuations, Corning's EBITDA remained relatively stable, with a peak in 2021, marking a 24% increase from its 2014 figures. This stability underscores Corning's strategic adaptability and its ability to capitalize on emerging market demands.
As we look to the future, these trends offer valuable insights into the strategic directions and market adaptability of these industry leaders.
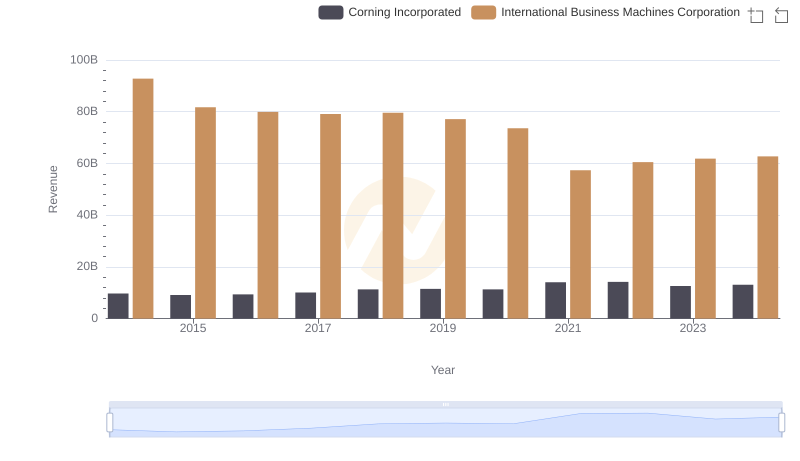
International Business Machines Corporation vs Corning Incorporated: Annual Revenue Growth Compared
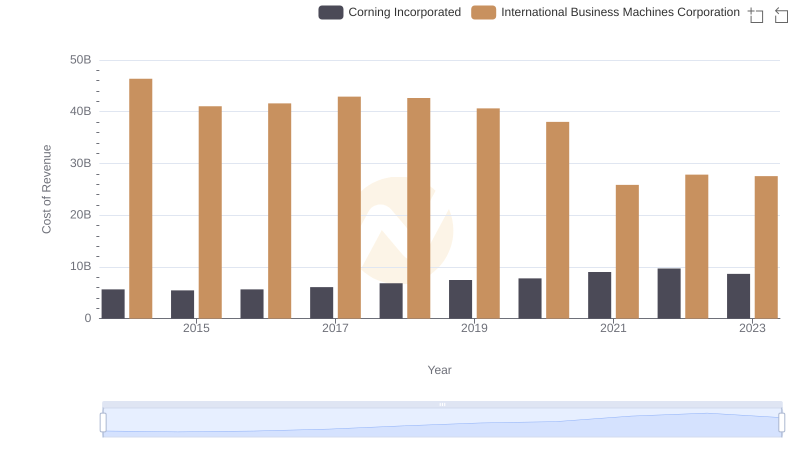
Cost of Revenue: Key Insights for International Business Machines Corporation and Corning Incorporated
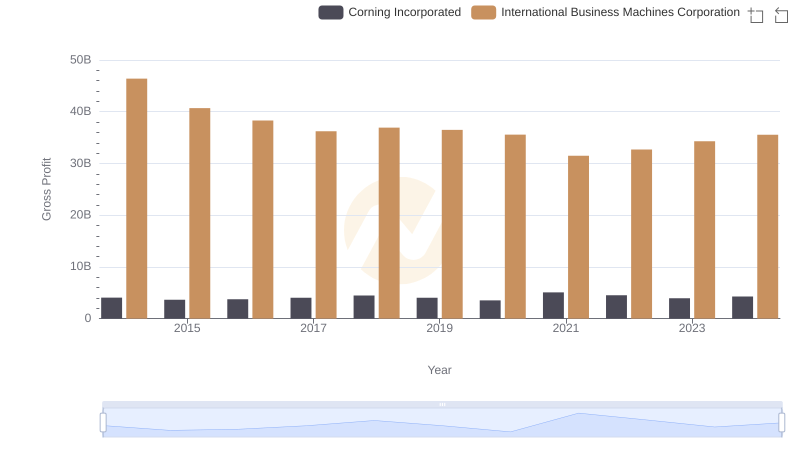
Key Insights on Gross Profit: International Business Machines Corporation vs Corning Incorporated
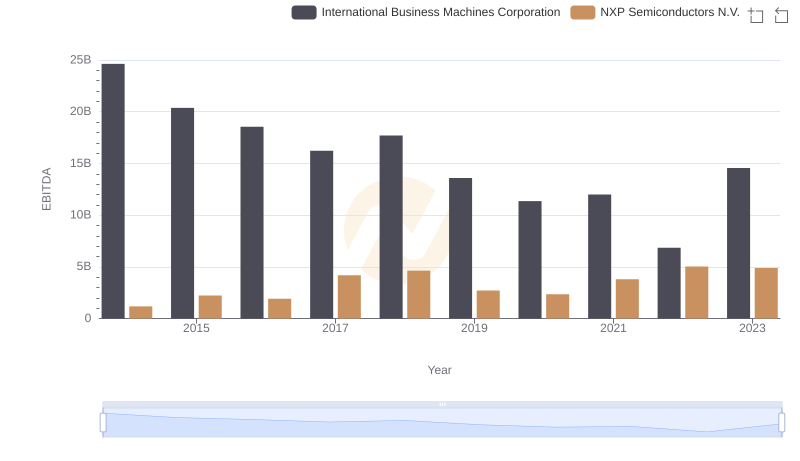
International Business Machines Corporation and NXP Semiconductors N.V.: A Detailed Examination of EBITDA Performance
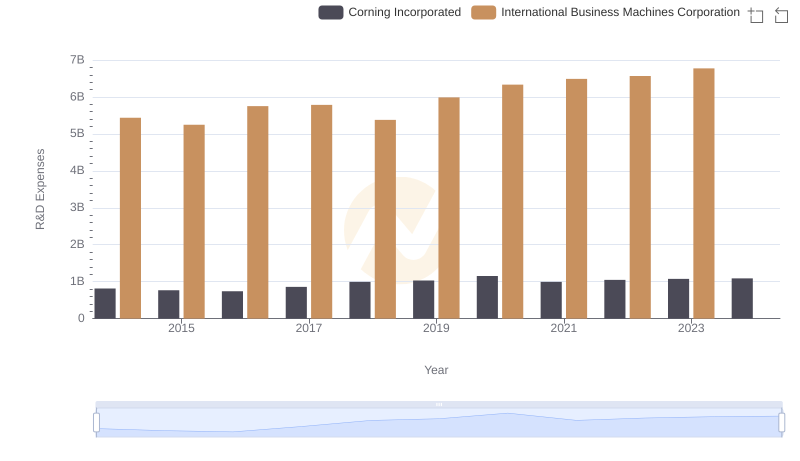
Research and Development: Comparing Key Metrics for International Business Machines Corporation and Corning Incorporated
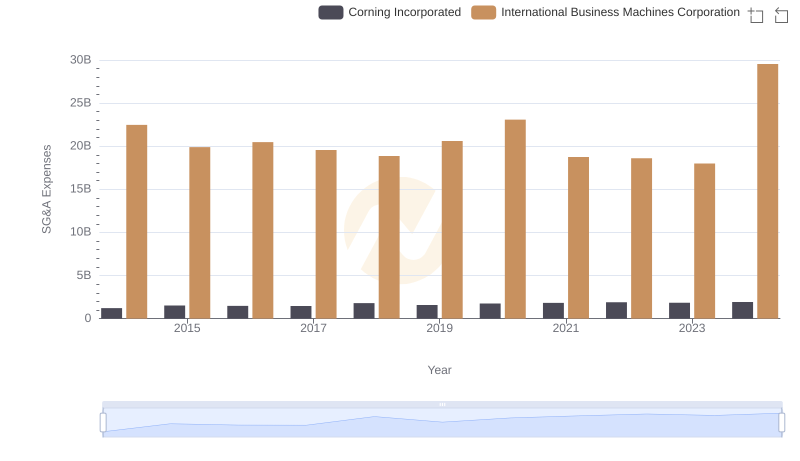
Selling, General, and Administrative Costs: International Business Machines Corporation vs Corning Incorporated
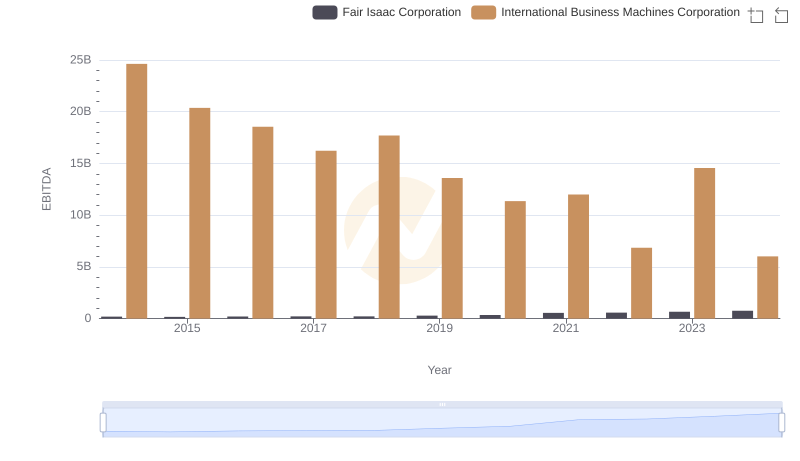
EBITDA Metrics Evaluated: International Business Machines Corporation vs Fair Isaac Corporation

International Business Machines Corporation vs Gartner, Inc.: In-Depth EBITDA Performance Comparison
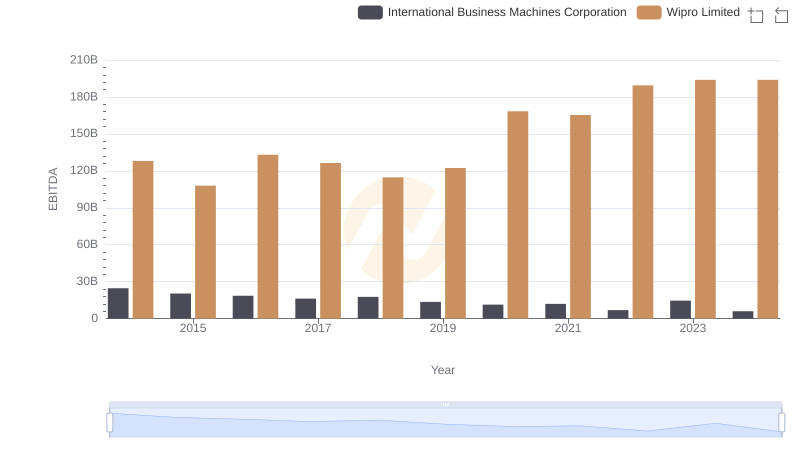
International Business Machines Corporation vs Wipro Limited: In-Depth EBITDA Performance Comparison
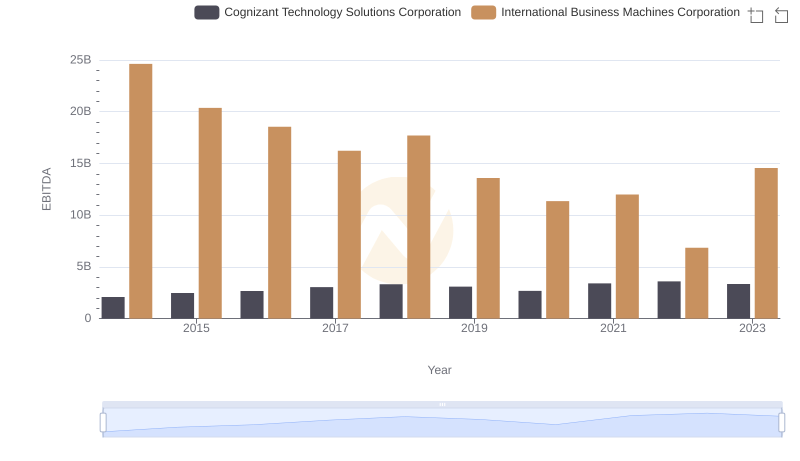
A Side-by-Side Analysis of EBITDA: International Business Machines Corporation and Cognizant Technology Solutions Corporation
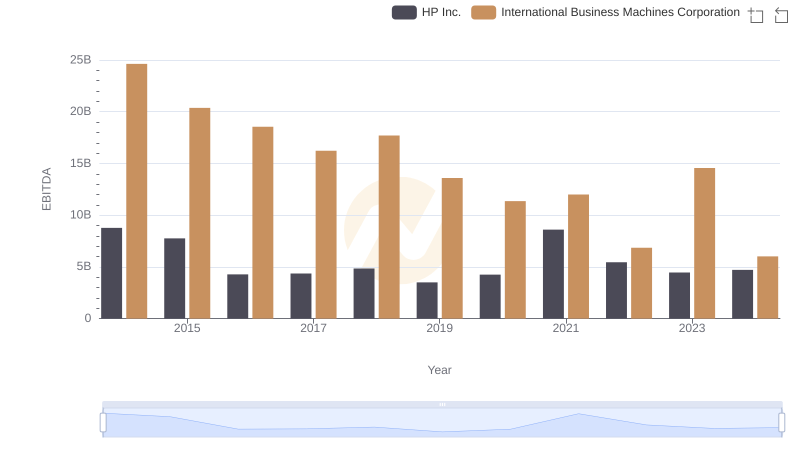
Professional EBITDA Benchmarking: International Business Machines Corporation vs HP Inc.
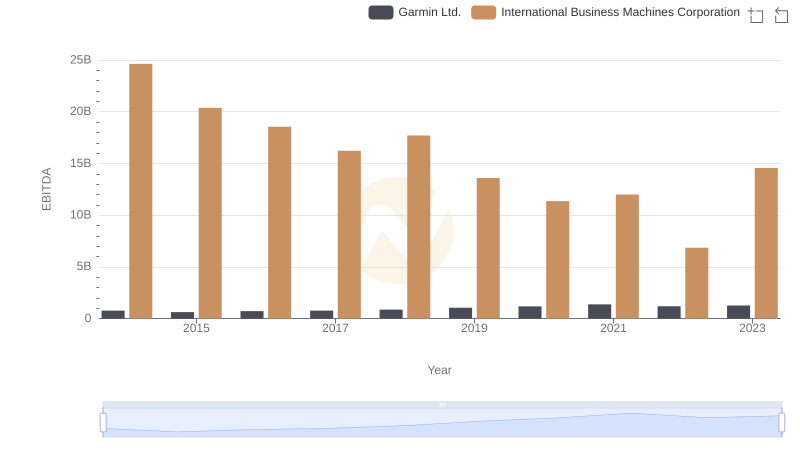
EBITDA Metrics Evaluated: International Business Machines Corporation vs Garmin Ltd.