| __timestamp | HP Inc. | International Business Machines Corporation |
|---|---|---|
| Wednesday, January 1, 2014 | 8766000000 | 24962000000 |
| Thursday, January 1, 2015 | 7760000000 | 20268000000 |
| Friday, January 1, 2016 | 4272000000 | 17341000000 |
| Sunday, January 1, 2017 | 4359000000 | 16556000000 |
| Monday, January 1, 2018 | 4847000000 | 16545000000 |
| Tuesday, January 1, 2019 | 3504000000 | 14609000000 |
| Wednesday, January 1, 2020 | 4256000000 | 10555000000 |
| Friday, January 1, 2021 | 8603000000 | 12409000000 |
| Saturday, January 1, 2022 | 5453000000 | 7174000000 |
| Sunday, January 1, 2023 | 4462000000 | 14693000000 |
| Monday, January 1, 2024 | 4716000000 | 6015000000 |
Igniting the spark of knowledge
In the ever-evolving landscape of technology giants, International Business Machines Corporation (IBM) and HP Inc. have been pivotal players. Over the past decade, from 2014 to 2024, these companies have showcased contrasting trajectories in their EBITDA performance. IBM, with its rich legacy, started strong in 2014, boasting an EBITDA nearly three times that of HP. However, by 2022, IBM's EBITDA had dwindled to just 28% of its 2014 peak, reflecting a significant shift in its business dynamics. Meanwhile, HP, despite a rocky start, demonstrated resilience, peaking in 2021 with an EBITDA that was 98% of its 2014 figure. This period highlights the strategic pivots and market challenges faced by these tech behemoths. As we look to the future, the data underscores the importance of adaptability and innovation in sustaining financial health in the tech industry.
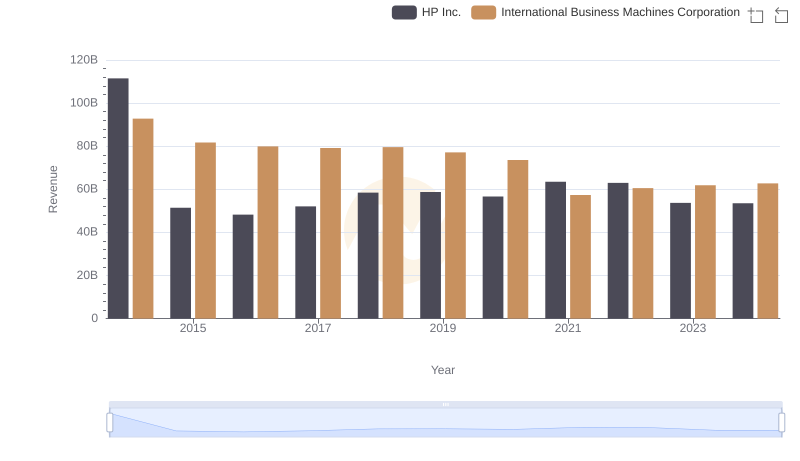
International Business Machines Corporation and HP Inc.: A Comprehensive Revenue Analysis
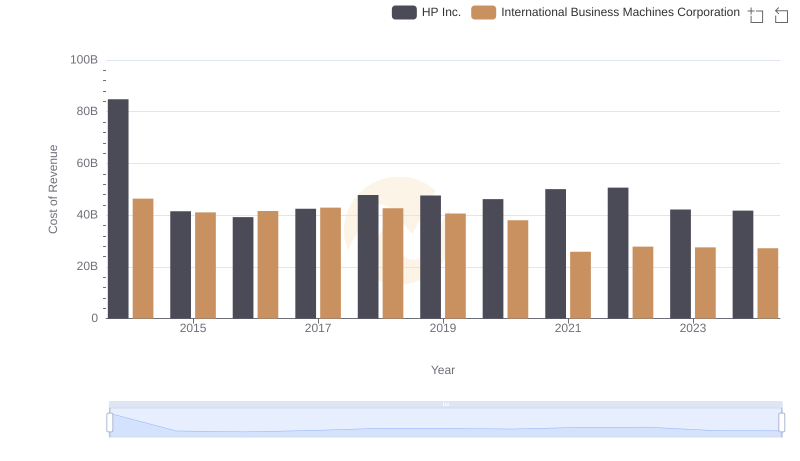
Cost of Revenue: Key Insights for International Business Machines Corporation and HP Inc.
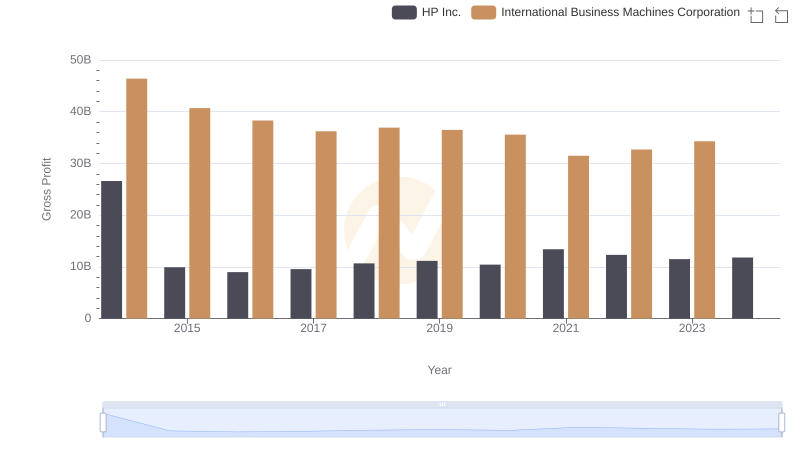
Key Insights on Gross Profit: International Business Machines Corporation vs HP Inc.
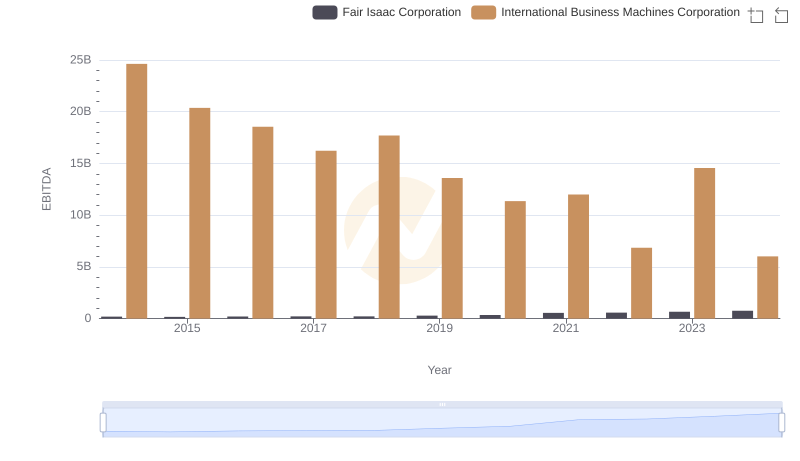
EBITDA Metrics Evaluated: International Business Machines Corporation vs Fair Isaac Corporation

International Business Machines Corporation vs Gartner, Inc.: In-Depth EBITDA Performance Comparison
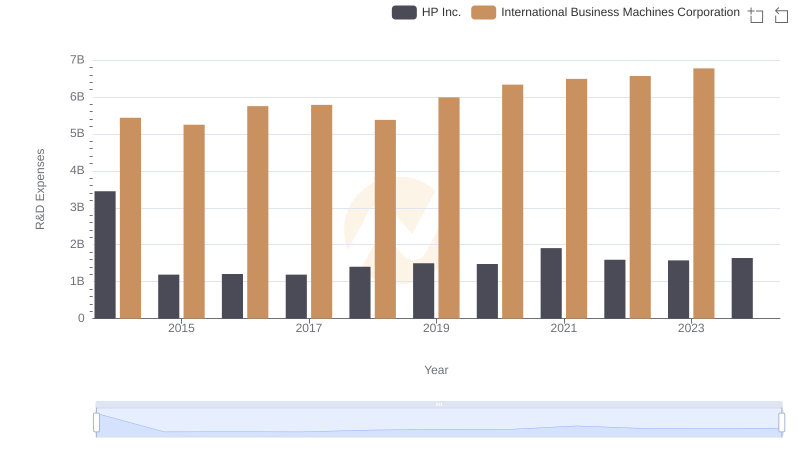
Analyzing R&D Budgets: International Business Machines Corporation vs HP Inc.
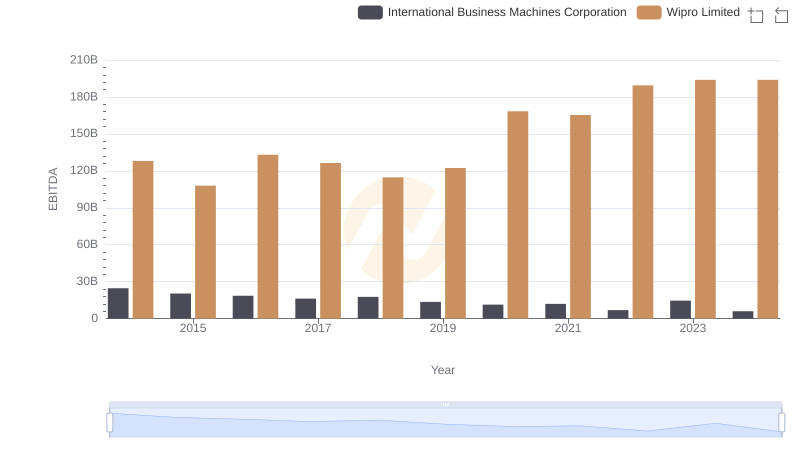
International Business Machines Corporation vs Wipro Limited: In-Depth EBITDA Performance Comparison
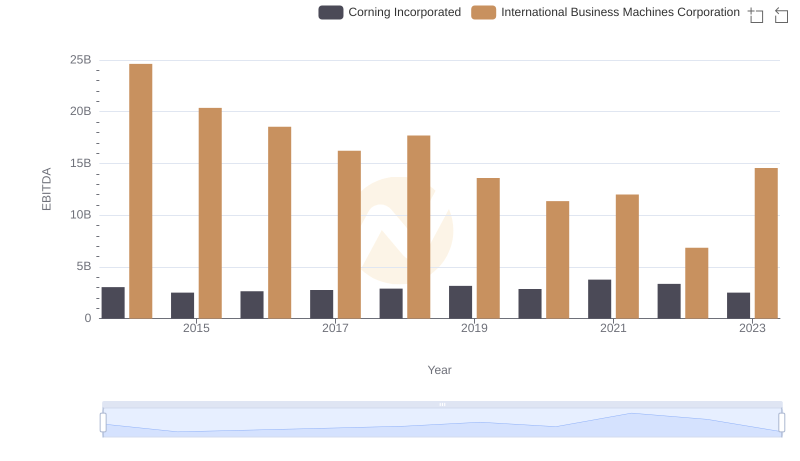
Comprehensive EBITDA Comparison: International Business Machines Corporation vs Corning Incorporated
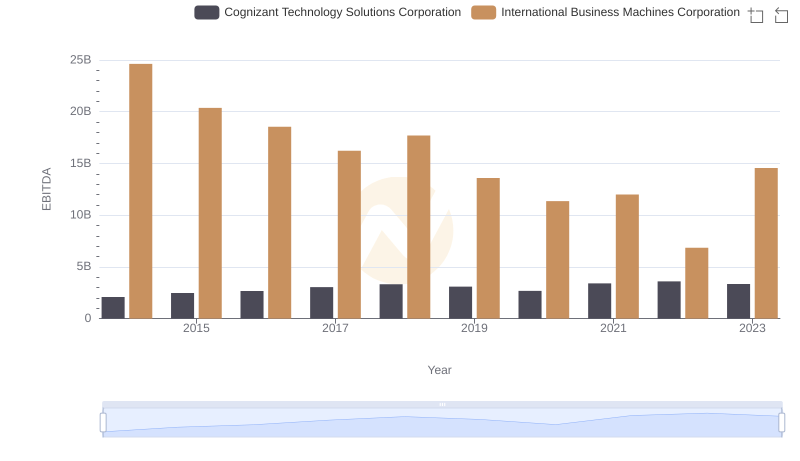
A Side-by-Side Analysis of EBITDA: International Business Machines Corporation and Cognizant Technology Solutions Corporation
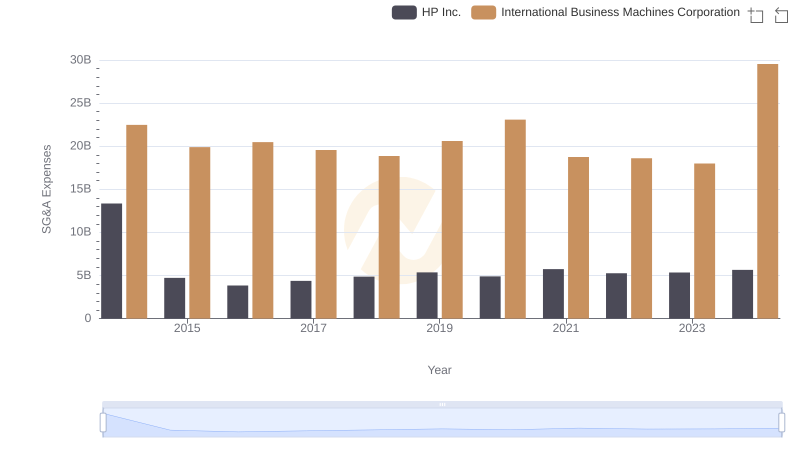
Breaking Down SG&A Expenses: International Business Machines Corporation vs HP Inc.
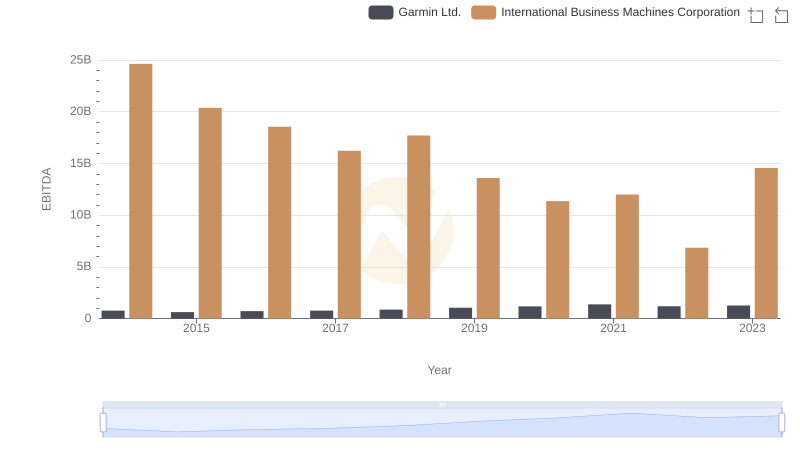
EBITDA Metrics Evaluated: International Business Machines Corporation vs Garmin Ltd.
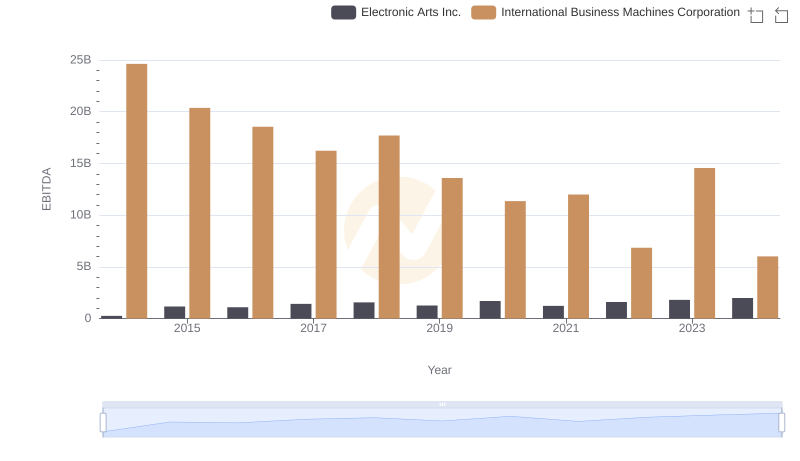
EBITDA Performance Review: International Business Machines Corporation vs Electronic Arts Inc.