| __timestamp | Cognizant Technology Solutions Corporation | International Business Machines Corporation |
|---|---|---|
| Wednesday, January 1, 2014 | 2093000000 | 24962000000 |
| Thursday, January 1, 2015 | 2472000000 | 20268000000 |
| Friday, January 1, 2016 | 2668000000 | 17341000000 |
| Sunday, January 1, 2017 | 3040000000 | 16556000000 |
| Monday, January 1, 2018 | 3322000000 | 16545000000 |
| Tuesday, January 1, 2019 | 3095000000 | 14609000000 |
| Wednesday, January 1, 2020 | 2679000000 | 10555000000 |
| Friday, January 1, 2021 | 3410000000 | 12409000000 |
| Saturday, January 1, 2022 | 3604000000 | 7174000000 |
| Sunday, January 1, 2023 | 3347000000 | 14693000000 |
| Monday, January 1, 2024 | 3534000000 | 6015000000 |
Unleashing insights
In the ever-evolving landscape of technology, the financial health of companies like International Business Machines Corporation (IBM) and Cognizant Technology Solutions Corporation is pivotal. Over the past decade, from 2014 to 2023, these giants have showcased intriguing trends in their EBITDA, a key indicator of operational performance.
IBM, a stalwart in the tech industry, saw its EBITDA peak in 2014, only to experience a gradual decline, reaching its lowest in 2022. This represents a significant drop of nearly 72% over the period. However, 2023 marked a resurgence, with EBITDA climbing back to 14.56 billion.
Conversely, Cognizant displayed a more stable trajectory, with EBITDA growing by approximately 60% from 2014 to 2022, peaking in 2022. Despite a slight dip in 2023, Cognizant's financial resilience remains evident.
This side-by-side analysis underscores the dynamic nature of the tech industry, where adaptability and innovation are key to sustained growth.
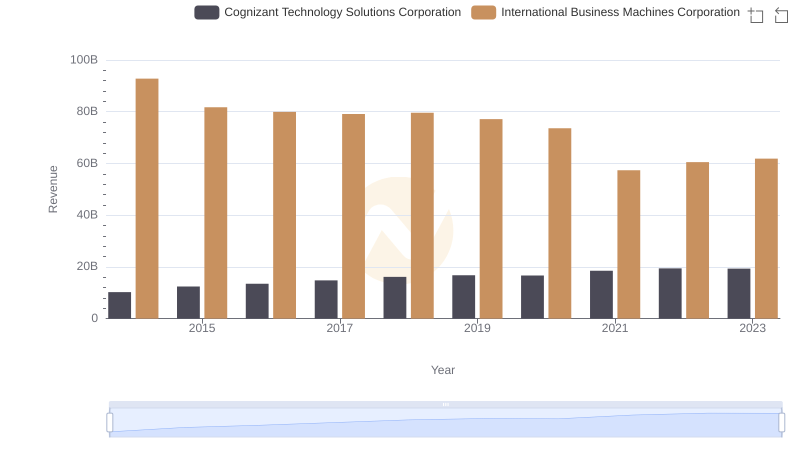
Breaking Down Revenue Trends: International Business Machines Corporation vs Cognizant Technology Solutions Corporation
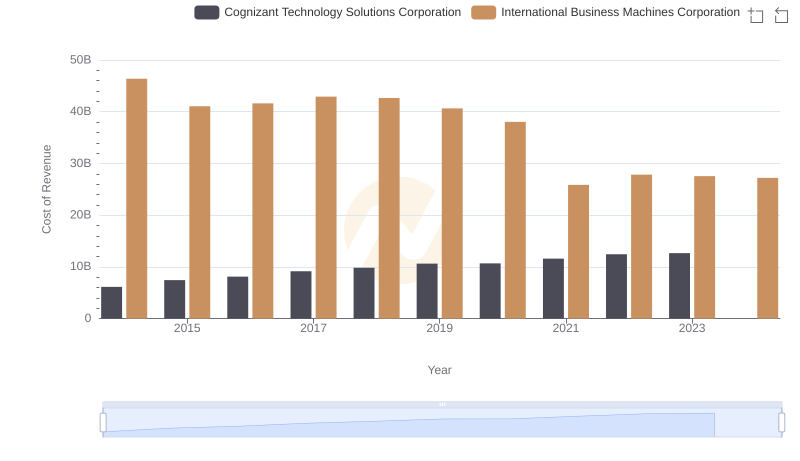
Analyzing Cost of Revenue: International Business Machines Corporation and Cognizant Technology Solutions Corporation
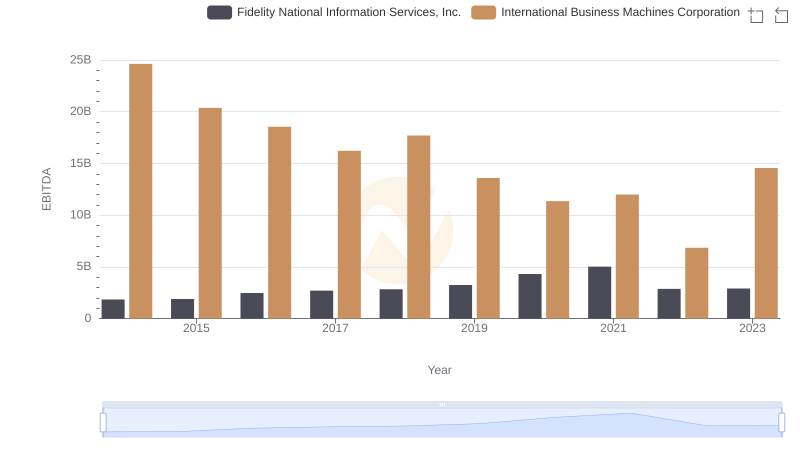
International Business Machines Corporation vs Fidelity National Information Services, Inc.: In-Depth EBITDA Performance Comparison
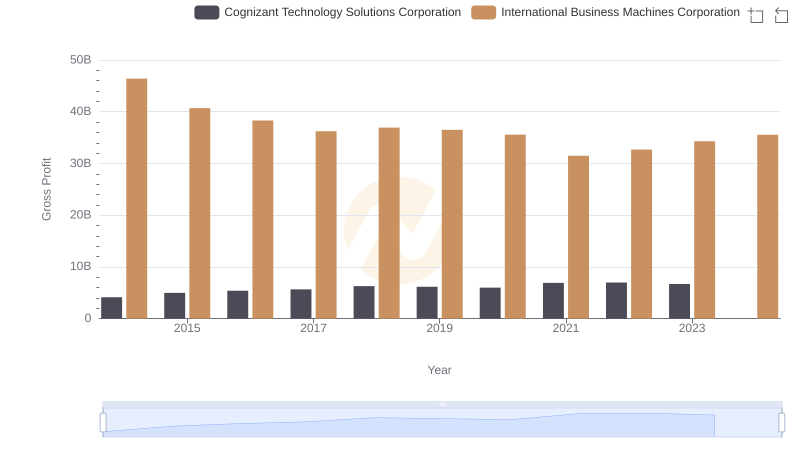
International Business Machines Corporation vs Cognizant Technology Solutions Corporation: A Gross Profit Performance Breakdown
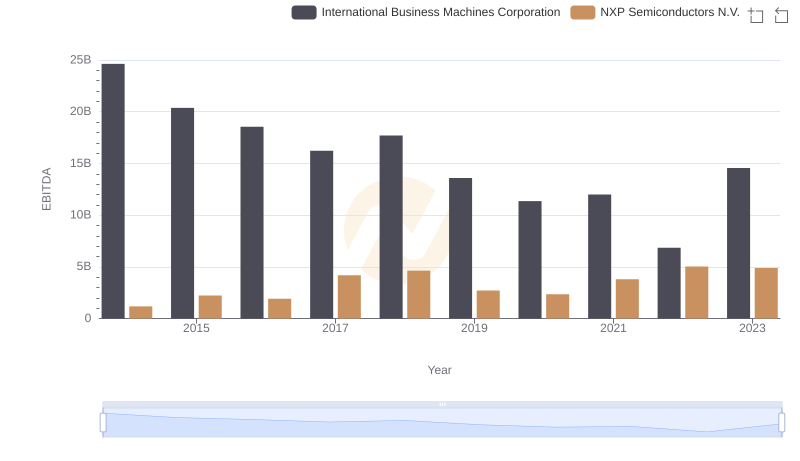
International Business Machines Corporation and NXP Semiconductors N.V.: A Detailed Examination of EBITDA Performance
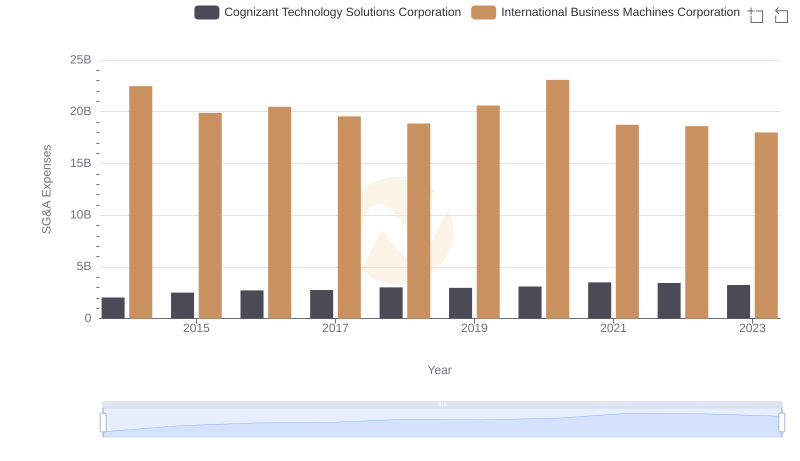
Who Optimizes SG&A Costs Better? International Business Machines Corporation or Cognizant Technology Solutions Corporation
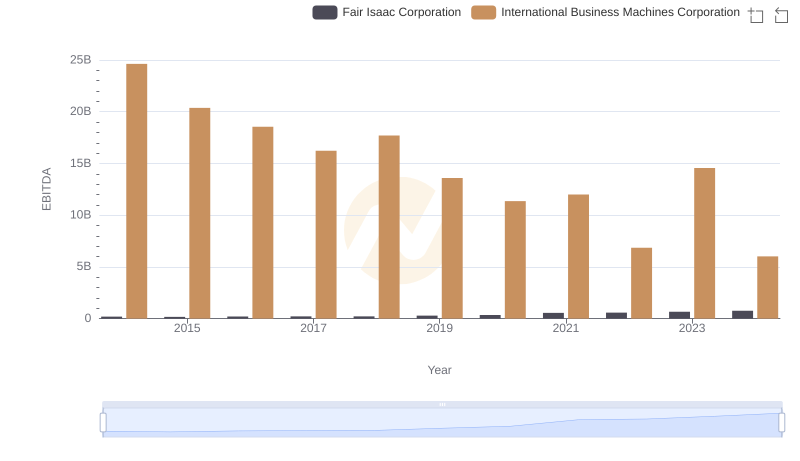
EBITDA Metrics Evaluated: International Business Machines Corporation vs Fair Isaac Corporation

International Business Machines Corporation vs Gartner, Inc.: In-Depth EBITDA Performance Comparison
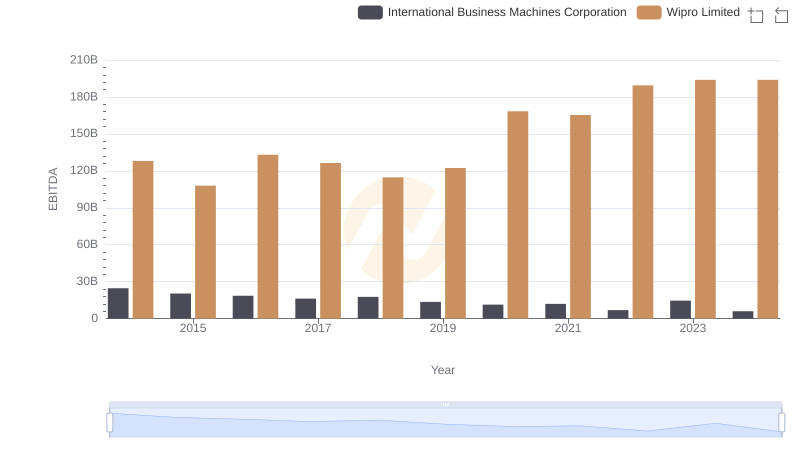
International Business Machines Corporation vs Wipro Limited: In-Depth EBITDA Performance Comparison
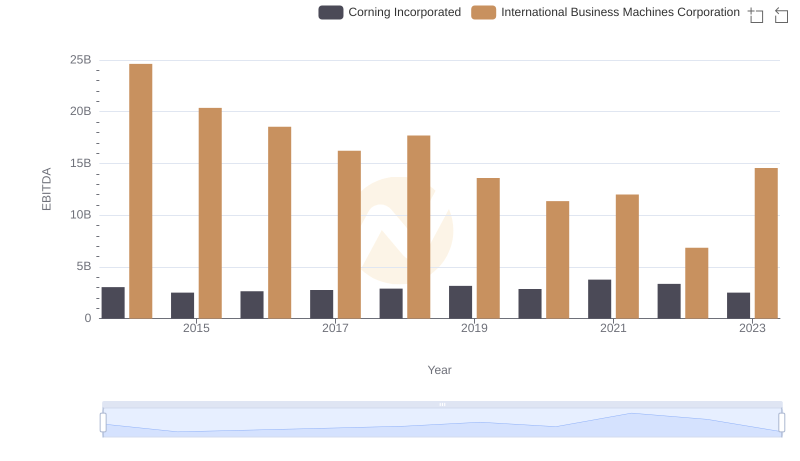
Comprehensive EBITDA Comparison: International Business Machines Corporation vs Corning Incorporated
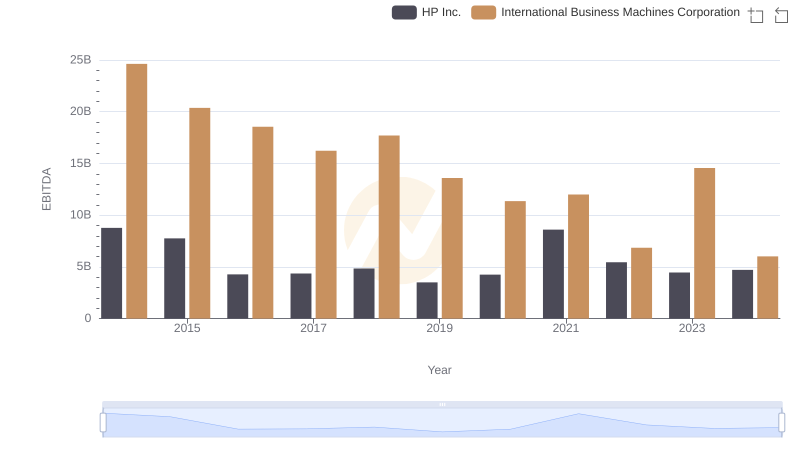
Professional EBITDA Benchmarking: International Business Machines Corporation vs HP Inc.
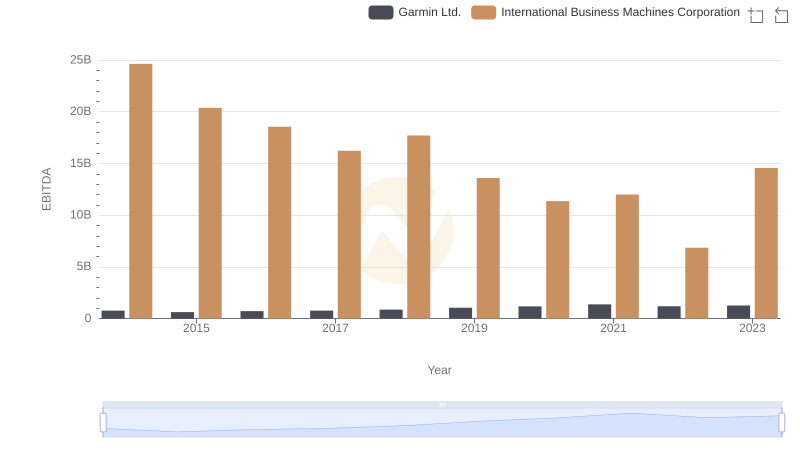
EBITDA Metrics Evaluated: International Business Machines Corporation vs Garmin Ltd.