| __timestamp | Lennox International Inc. | Saia, Inc. |
|---|---|---|
| Wednesday, January 1, 2014 | 387700000 | 144715000 |
| Thursday, January 1, 2015 | 423600000 | 154995000 |
| Friday, January 1, 2016 | 490800000 | 156092000 |
| Sunday, January 1, 2017 | 562900000 | 181629000 |
| Monday, January 1, 2018 | 575200000 | 243709000 |
| Tuesday, January 1, 2019 | 633300000 | 271318000 |
| Wednesday, January 1, 2020 | 553900000 | 312448000 |
| Friday, January 1, 2021 | 652500000 | 472947000 |
| Saturday, January 1, 2022 | 729000000 | 627741000 |
| Sunday, January 1, 2023 | 879500000 | 647607000 |
| Monday, January 1, 2024 | 1034800000 |
Data in motion
In the ever-evolving landscape of the HVAC and logistics industries, Lennox International Inc. and Saia, Inc. have demonstrated remarkable EBITDA growth over the past decade. From 2014 to 2023, Lennox International Inc. has seen its EBITDA surge by approximately 167%, reflecting its robust market strategies and operational efficiencies. Meanwhile, Saia, Inc. has experienced an impressive 347% increase, showcasing its dynamic expansion in the logistics sector.
The data for 2024 remains incomplete, leaving room for speculation on future trends.
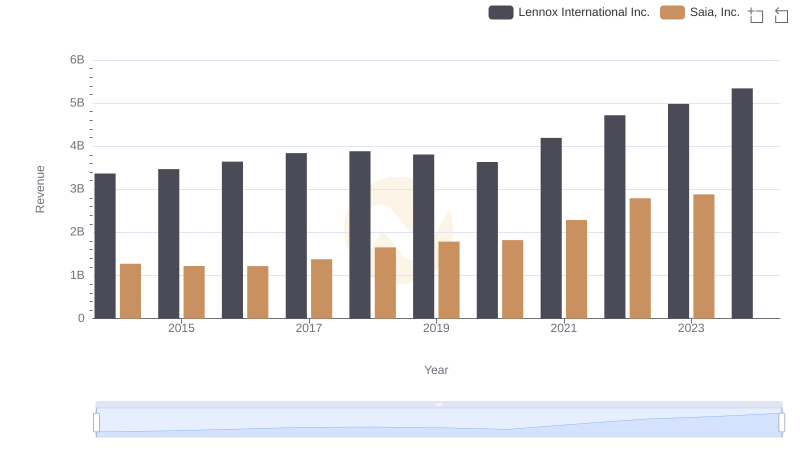
Revenue Insights: Lennox International Inc. and Saia, Inc. Performance Compared
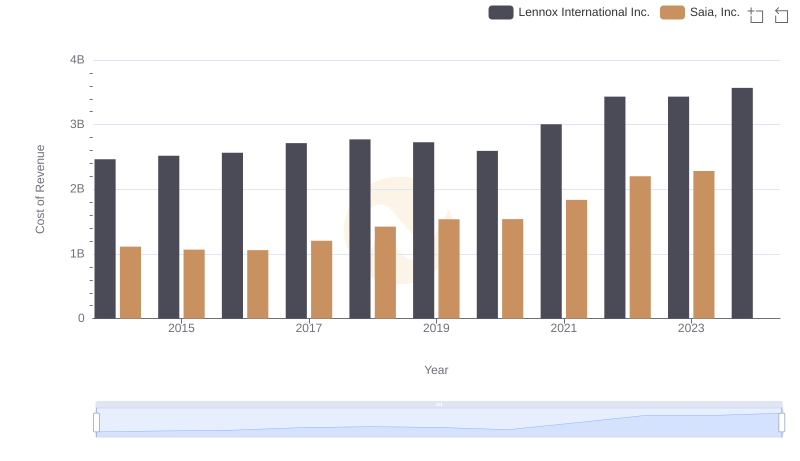
Cost Insights: Breaking Down Lennox International Inc. and Saia, Inc.'s Expenses
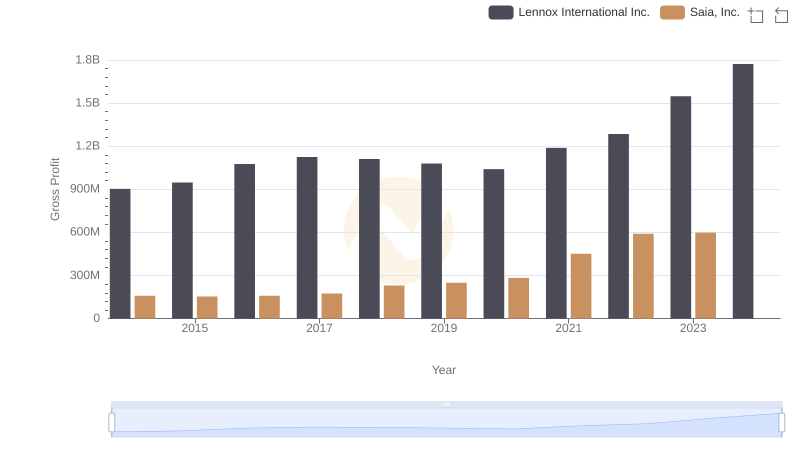
Gross Profit Trends Compared: Lennox International Inc. vs Saia, Inc.
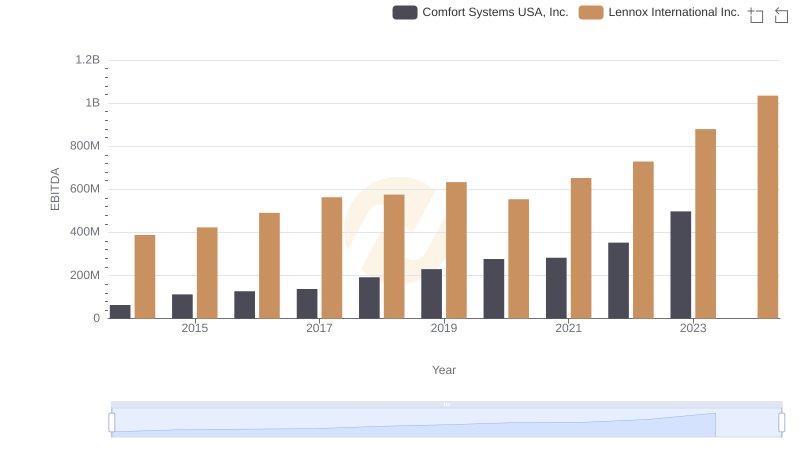
A Professional Review of EBITDA: Lennox International Inc. Compared to Comfort Systems USA, Inc.
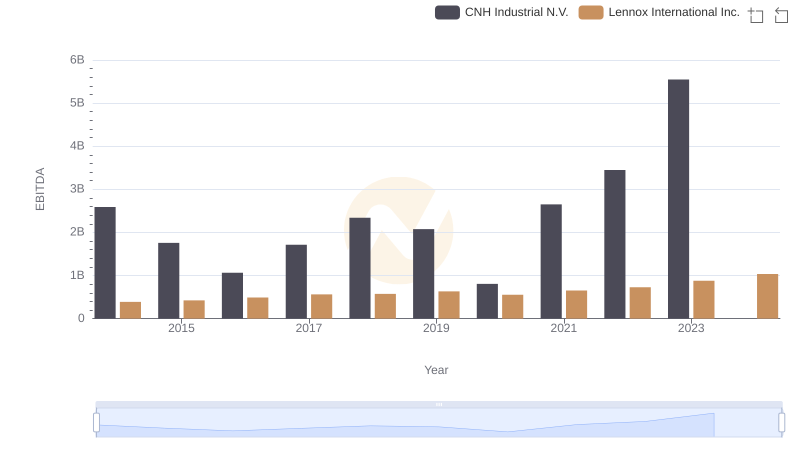
Comprehensive EBITDA Comparison: Lennox International Inc. vs CNH Industrial N.V.

Lennox International Inc. vs Saia, Inc.: SG&A Expense Trends
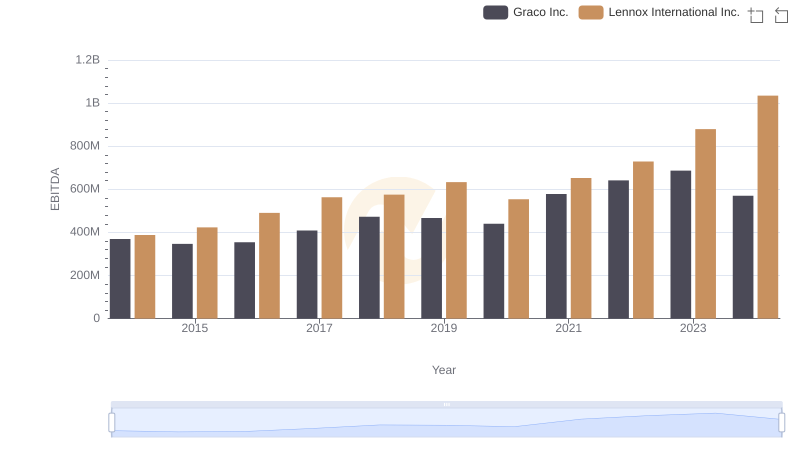
Comparative EBITDA Analysis: Lennox International Inc. vs Graco Inc.

Professional EBITDA Benchmarking: Lennox International Inc. vs Stanley Black & Decker, Inc.
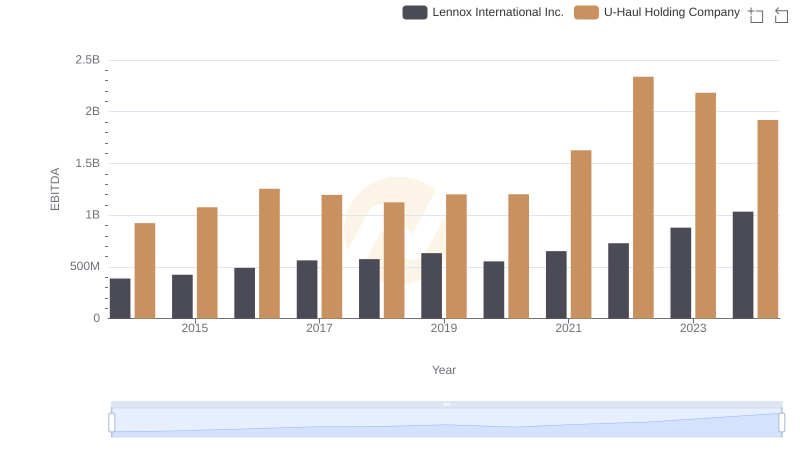
A Professional Review of EBITDA: Lennox International Inc. Compared to U-Haul Holding Company
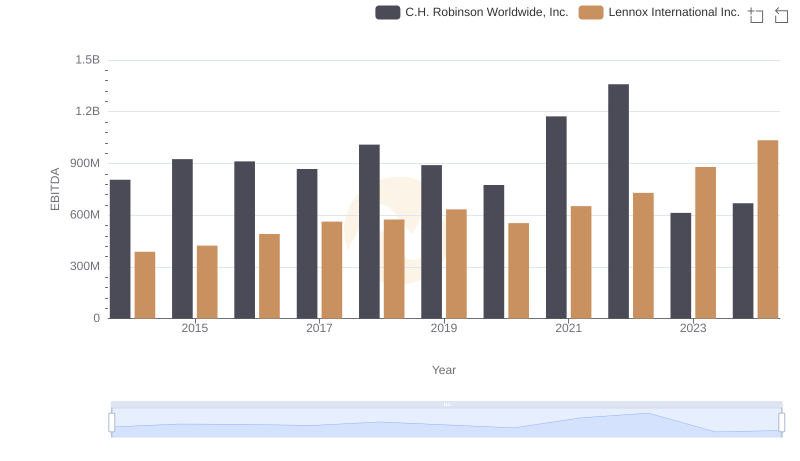
A Professional Review of EBITDA: Lennox International Inc. Compared to C.H. Robinson Worldwide, Inc.
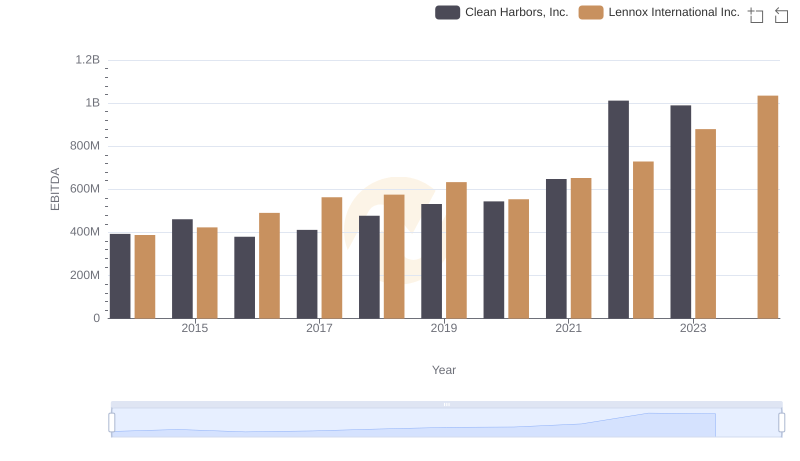
Comparative EBITDA Analysis: Lennox International Inc. vs Clean Harbors, Inc.
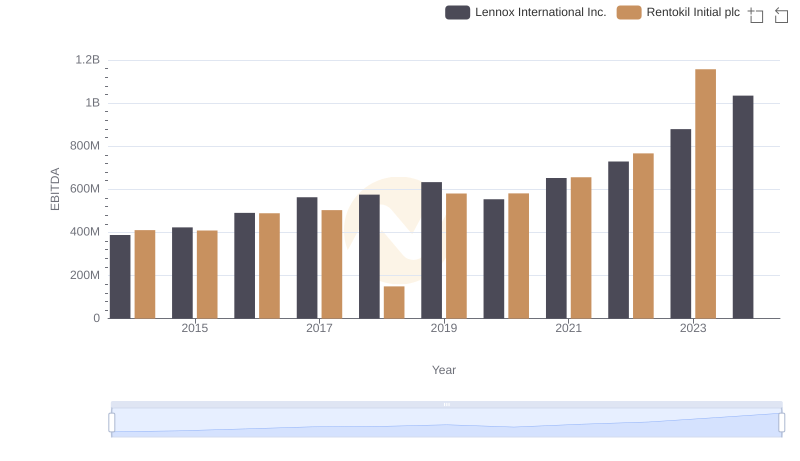
Lennox International Inc. vs Rentokil Initial plc: In-Depth EBITDA Performance Comparison