| __timestamp | Graco Inc. | Lennox International Inc. |
|---|---|---|
| Wednesday, January 1, 2014 | 369321000 | 387700000 |
| Thursday, January 1, 2015 | 346732000 | 423600000 |
| Friday, January 1, 2016 | 354454000 | 490800000 |
| Sunday, January 1, 2017 | 408879000 | 562900000 |
| Monday, January 1, 2018 | 472905000 | 575200000 |
| Tuesday, January 1, 2019 | 466687000 | 633300000 |
| Wednesday, January 1, 2020 | 440431000 | 553900000 |
| Friday, January 1, 2021 | 578005000 | 652500000 |
| Saturday, January 1, 2022 | 641618000 | 729000000 |
| Sunday, January 1, 2023 | 686593000 | 879500000 |
| Monday, January 1, 2024 | 570098000 | 1034800000 |
Unleashing the power of data
In the competitive landscape of industrial manufacturing, Lennox International Inc. and Graco Inc. have demonstrated remarkable EBITDA growth over the past decade. From 2014 to 2023, Lennox International Inc. has seen its EBITDA surge by approximately 170%, reaching a peak in 2023. Meanwhile, Graco Inc. has also experienced a robust increase of around 86% during the same period.
This comparative analysis highlights the resilience and strategic prowess of these industry leaders, offering valuable insights for investors and stakeholders alike.
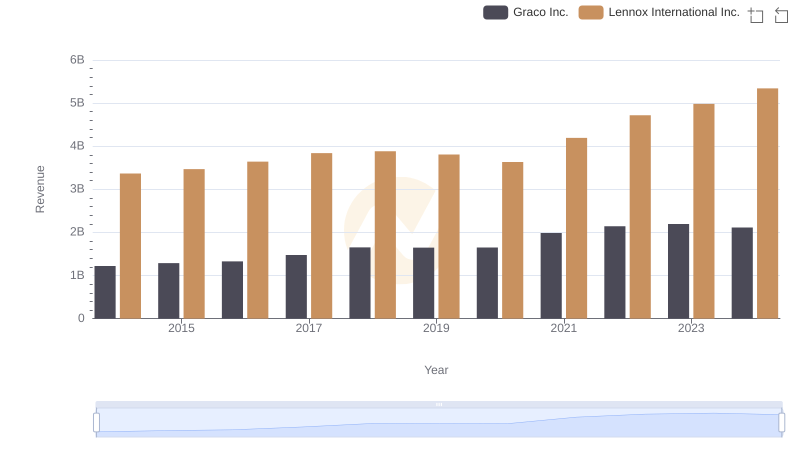
Revenue Showdown: Lennox International Inc. vs Graco Inc.
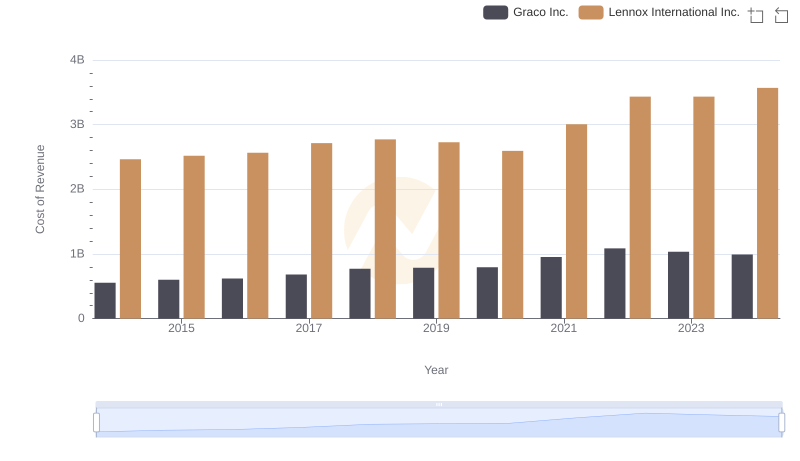
Cost of Revenue Comparison: Lennox International Inc. vs Graco Inc.
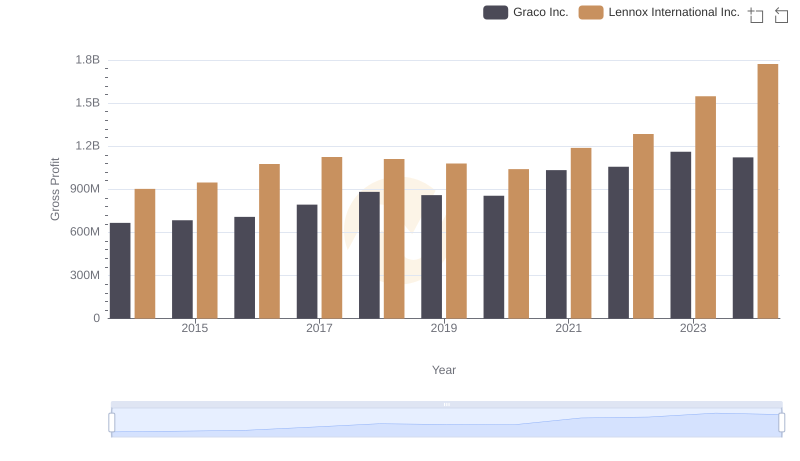
Lennox International Inc. and Graco Inc.: A Detailed Gross Profit Analysis
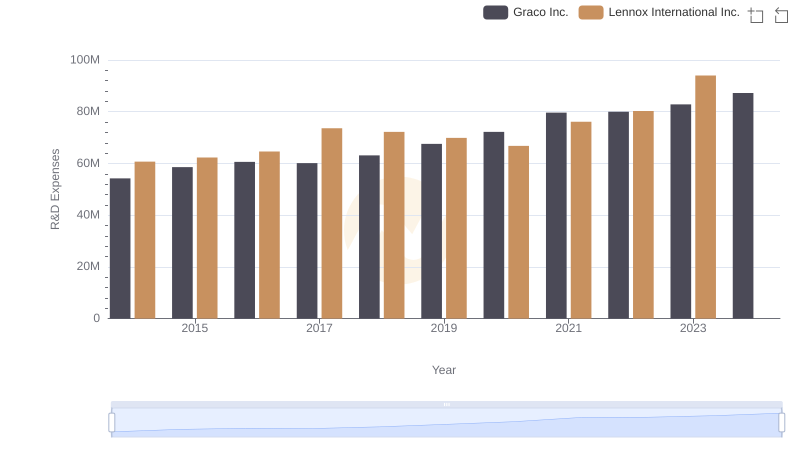
Lennox International Inc. or Graco Inc.: Who Invests More in Innovation?
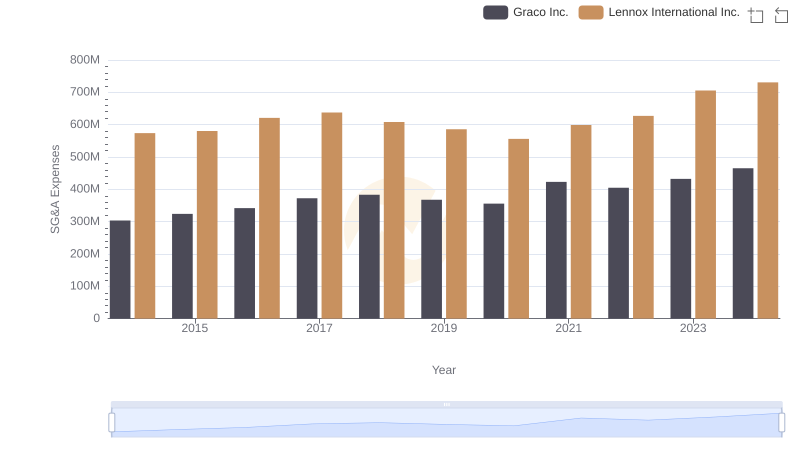
Who Optimizes SG&A Costs Better? Lennox International Inc. or Graco Inc.
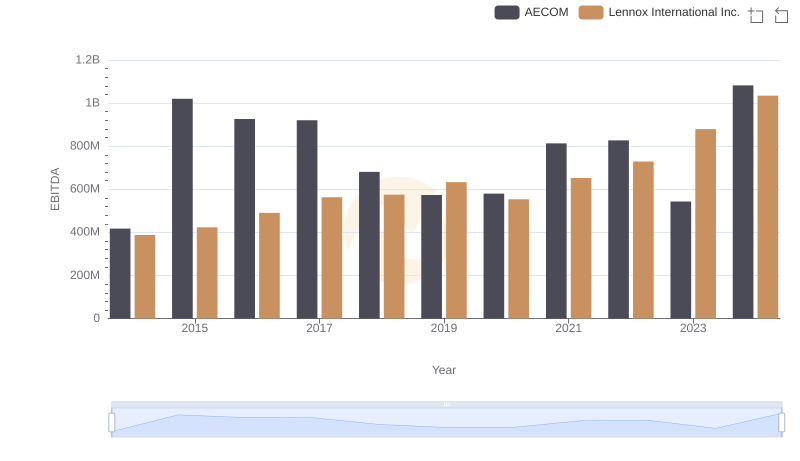
EBITDA Analysis: Evaluating Lennox International Inc. Against AECOM
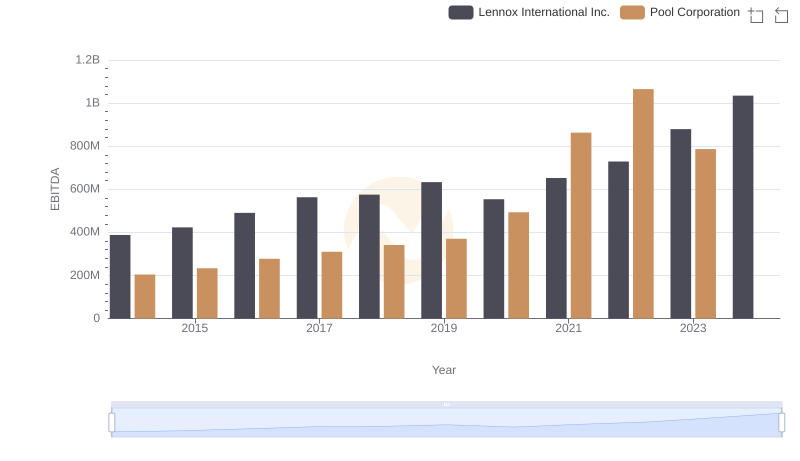
EBITDA Analysis: Evaluating Lennox International Inc. Against Pool Corporation
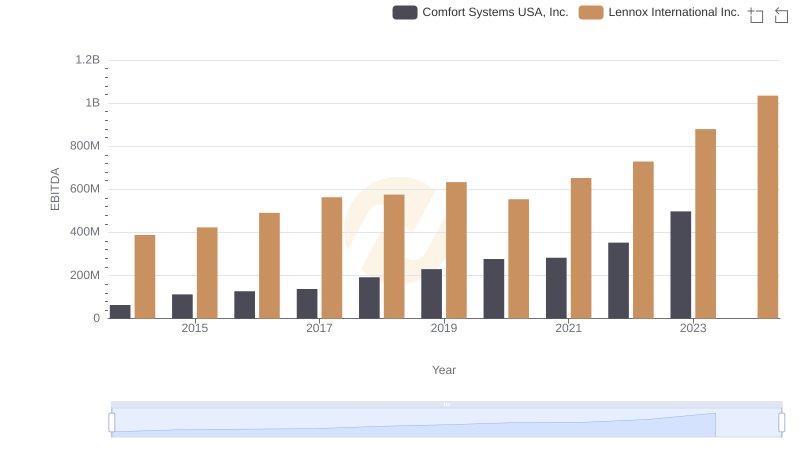
A Professional Review of EBITDA: Lennox International Inc. Compared to Comfort Systems USA, Inc.
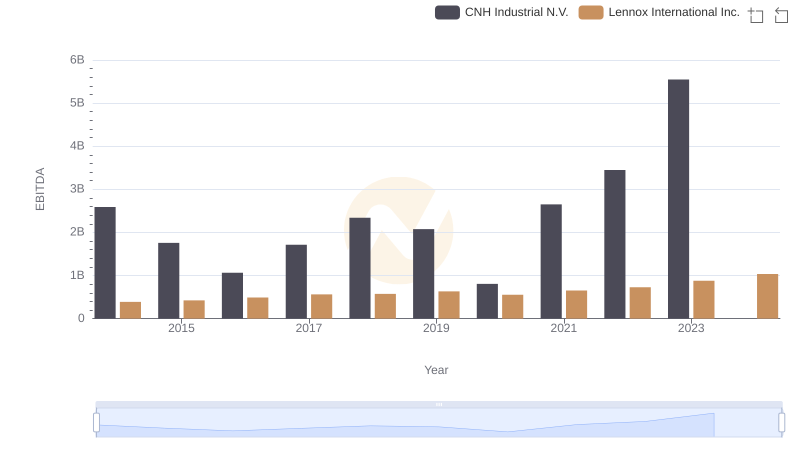
Comprehensive EBITDA Comparison: Lennox International Inc. vs CNH Industrial N.V.

Professional EBITDA Benchmarking: Lennox International Inc. vs Stanley Black & Decker, Inc.
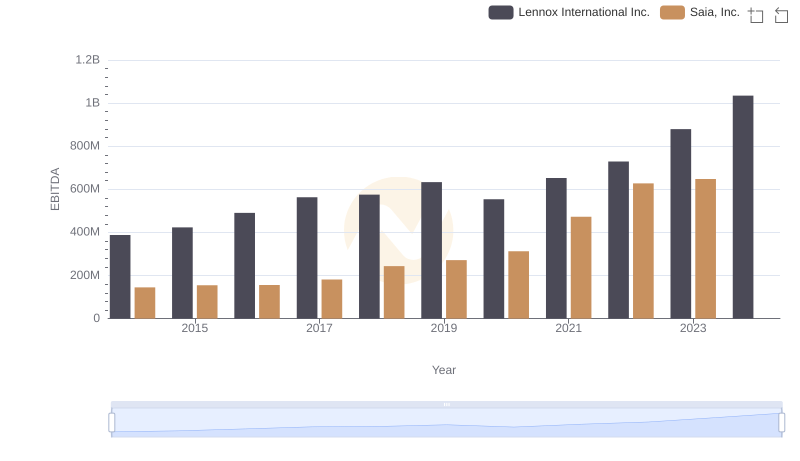
Comprehensive EBITDA Comparison: Lennox International Inc. vs Saia, Inc.
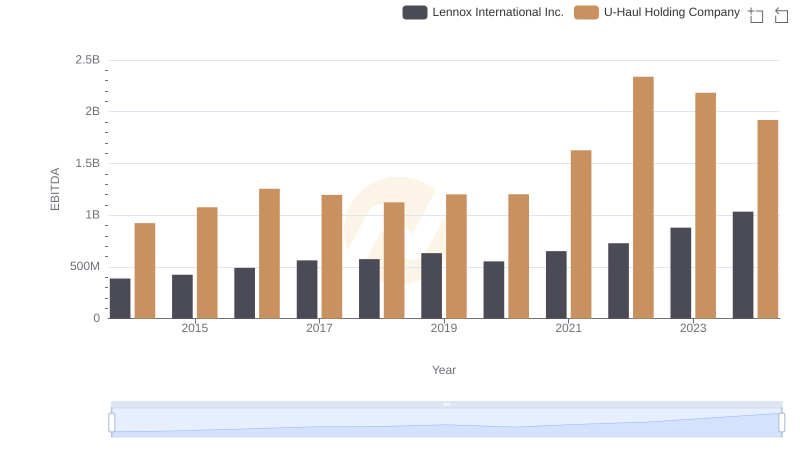
A Professional Review of EBITDA: Lennox International Inc. Compared to U-Haul Holding Company