| __timestamp | Lennox International Inc. | Stanley Black & Decker, Inc. |
|---|---|---|
| Wednesday, January 1, 2014 | 387700000 | 1975400000 |
| Thursday, January 1, 2015 | 423600000 | 1741900000 |
| Friday, January 1, 2016 | 490800000 | 1810200000 |
| Sunday, January 1, 2017 | 562900000 | 2196000000 |
| Monday, January 1, 2018 | 575200000 | 1791200000 |
| Tuesday, January 1, 2019 | 633300000 | 1920600000 |
| Wednesday, January 1, 2020 | 553900000 | 2004200000 |
| Friday, January 1, 2021 | 652500000 | 2345500000 |
| Saturday, January 1, 2022 | 729000000 | 942800000 |
| Sunday, January 1, 2023 | 879500000 | 802700000 |
| Monday, January 1, 2024 | 1034800000 | 286300000 |
Data in motion
In the competitive landscape of industrial manufacturing, Lennox International Inc. and Stanley Black & Decker, Inc. have been pivotal players. Over the past decade, from 2014 to 2023, these companies have showcased contrasting trajectories in their EBITDA performance. Lennox International Inc. has seen a remarkable growth of approximately 167%, starting from 39% of Stanley Black & Decker's EBITDA in 2014 to surpassing it by 2023. This shift highlights Lennox's strategic advancements and operational efficiencies.
Conversely, Stanley Black & Decker, Inc. experienced fluctuations, peaking in 2021 but witnessing a significant drop of around 66% by 2023. This decline could be attributed to market dynamics or internal challenges. The data for 2024 remains incomplete, leaving room for speculation on future trends. As these industry titans navigate the evolving market, their financial strategies will be crucial in shaping their competitive edge.

Lennox International Inc. vs Stanley Black & Decker, Inc.: Annual Revenue Growth Compared
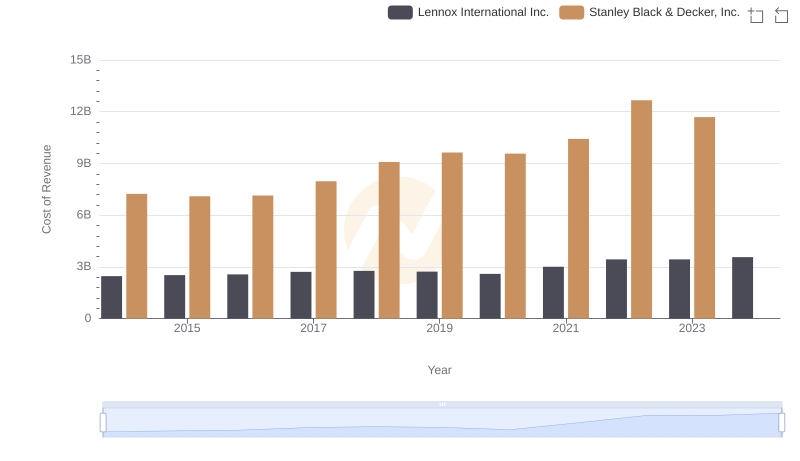
Lennox International Inc. vs Stanley Black & Decker, Inc.: Efficiency in Cost of Revenue Explored

Key Insights on Gross Profit: Lennox International Inc. vs Stanley Black & Decker, Inc.
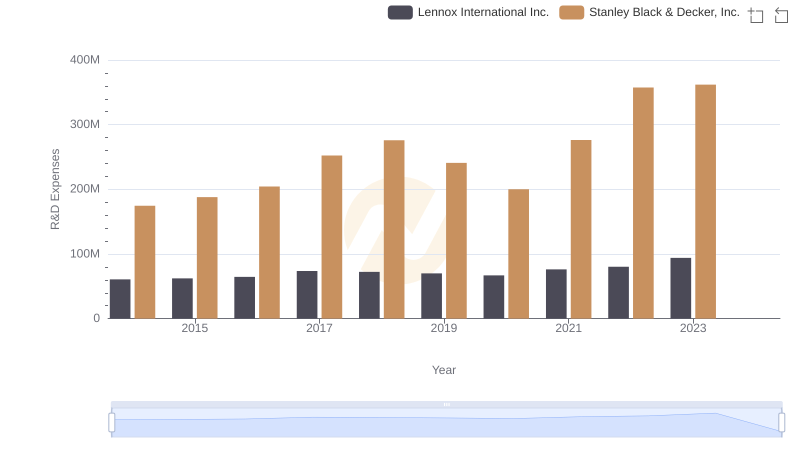
Research and Development Expenses Breakdown: Lennox International Inc. vs Stanley Black & Decker, Inc.
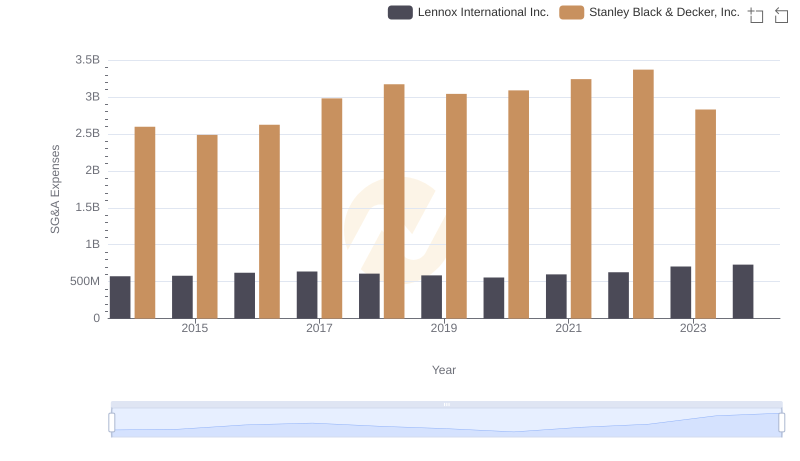
Who Optimizes SG&A Costs Better? Lennox International Inc. or Stanley Black & Decker, Inc.

A Professional Review of EBITDA: Lennox International Inc. Compared to Stanley Black & Decker, Inc.
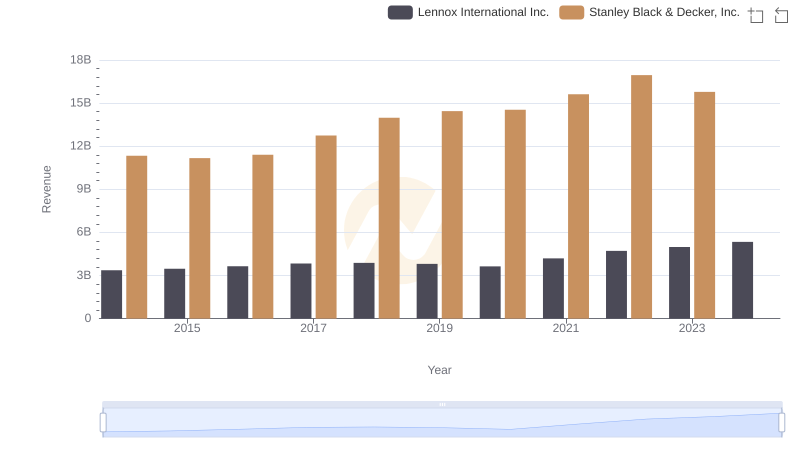
Lennox International Inc. and Stanley Black & Decker, Inc.: A Comprehensive Revenue Analysis

Analyzing Cost of Revenue: Lennox International Inc. and Stanley Black & Decker, Inc.
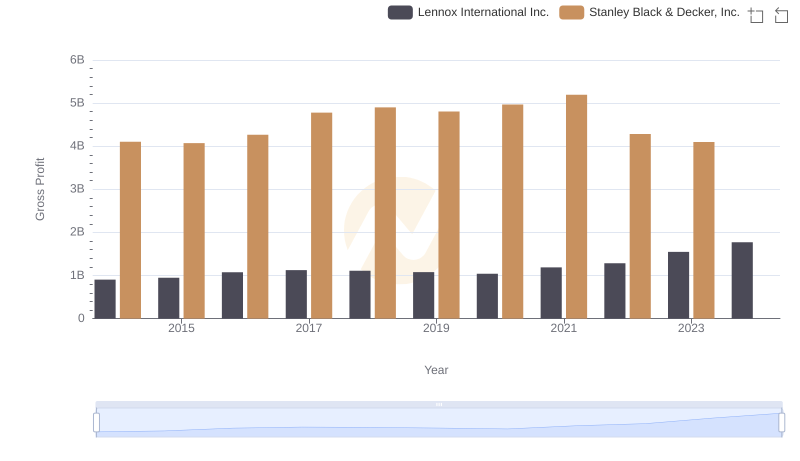
Lennox International Inc. vs Stanley Black & Decker, Inc.: A Gross Profit Performance Breakdown

Research and Development: Comparing Key Metrics for Lennox International Inc. and Stanley Black & Decker, Inc.

Comparing SG&A Expenses: Lennox International Inc. vs Stanley Black & Decker, Inc. Trends and Insights
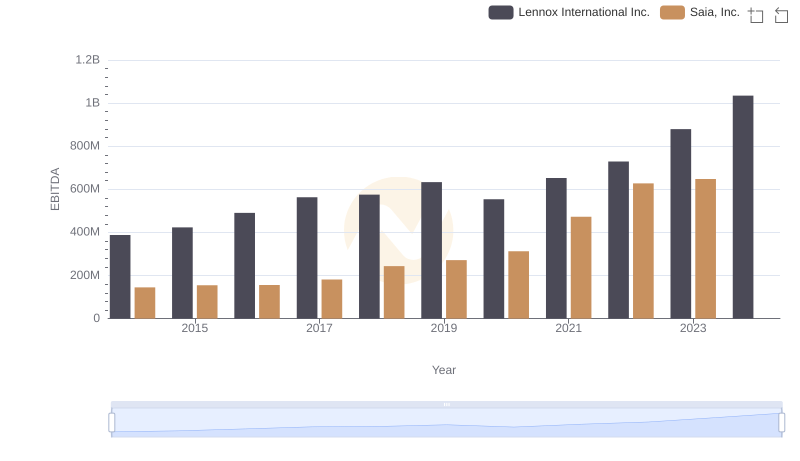
Comprehensive EBITDA Comparison: Lennox International Inc. vs Saia, Inc.