| __timestamp | CNH Industrial N.V. | Lennox International Inc. |
|---|---|---|
| Wednesday, January 1, 2014 | 2591000000 | 387700000 |
| Thursday, January 1, 2015 | 1757000000 | 423600000 |
| Friday, January 1, 2016 | 1063000000 | 490800000 |
| Sunday, January 1, 2017 | 1715000000 | 562900000 |
| Monday, January 1, 2018 | 2339000000 | 575200000 |
| Tuesday, January 1, 2019 | 2077000000 | 633300000 |
| Wednesday, January 1, 2020 | 807000000 | 553900000 |
| Friday, January 1, 2021 | 2650000000 | 652500000 |
| Saturday, January 1, 2022 | 3447000000 | 729000000 |
| Sunday, January 1, 2023 | 5549000000 | 879500000 |
| Monday, January 1, 2024 | 1034800000 |
Igniting the spark of knowledge
In the ever-evolving landscape of industrial giants, Lennox International Inc. and CNH Industrial N.V. have showcased intriguing financial trajectories over the past decade. From 2014 to 2023, CNH Industrial N.V. experienced a remarkable 114% increase in EBITDA, peaking in 2023. This growth underscores its robust market strategies and adaptability. In contrast, Lennox International Inc. demonstrated steady growth, with a 127% rise in EBITDA, reflecting its consistent performance and resilience.
This comparison not only highlights the financial health of these companies but also offers insights into their strategic directions in a competitive market.
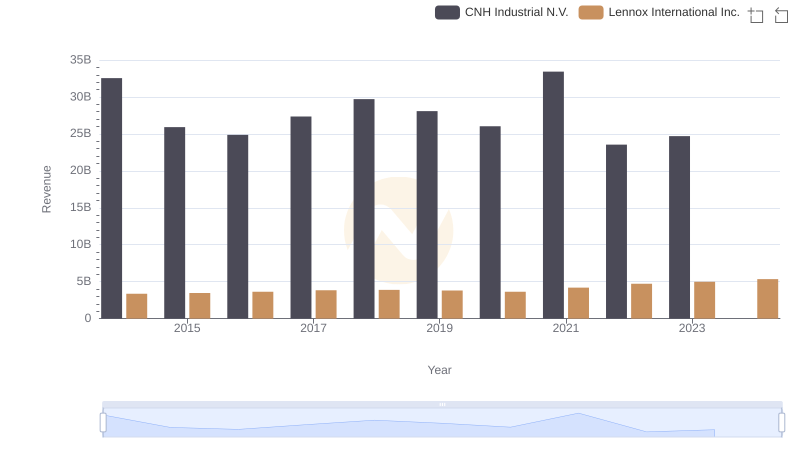
Lennox International Inc. and CNH Industrial N.V.: A Comprehensive Revenue Analysis
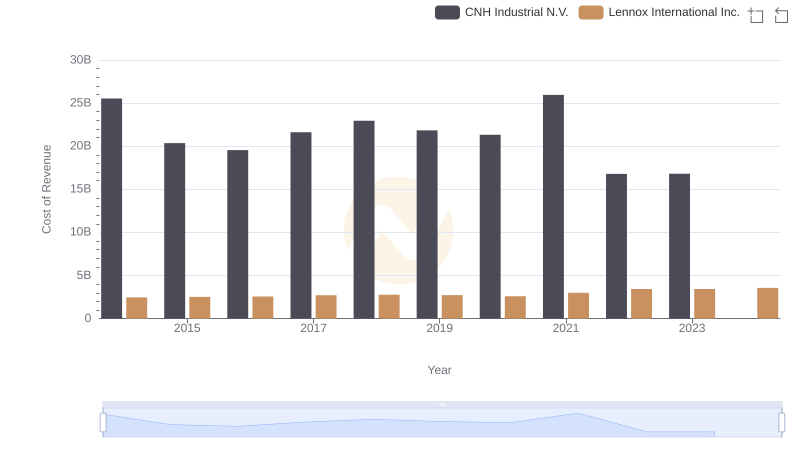
Cost of Revenue Trends: Lennox International Inc. vs CNH Industrial N.V.
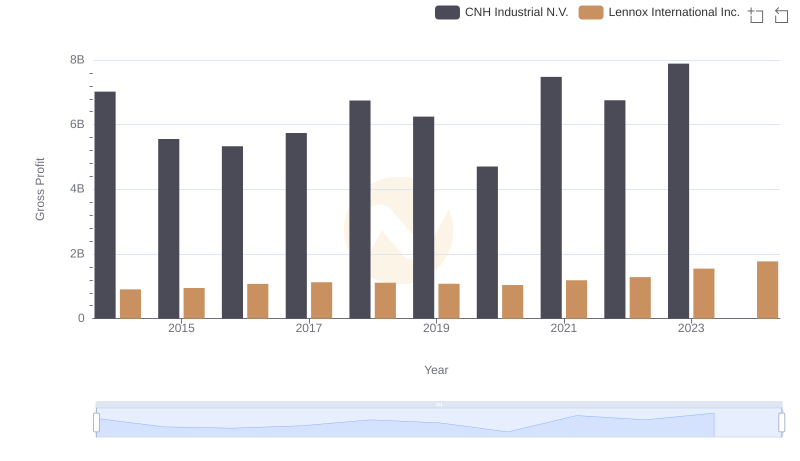
Lennox International Inc. and CNH Industrial N.V.: A Detailed Gross Profit Analysis
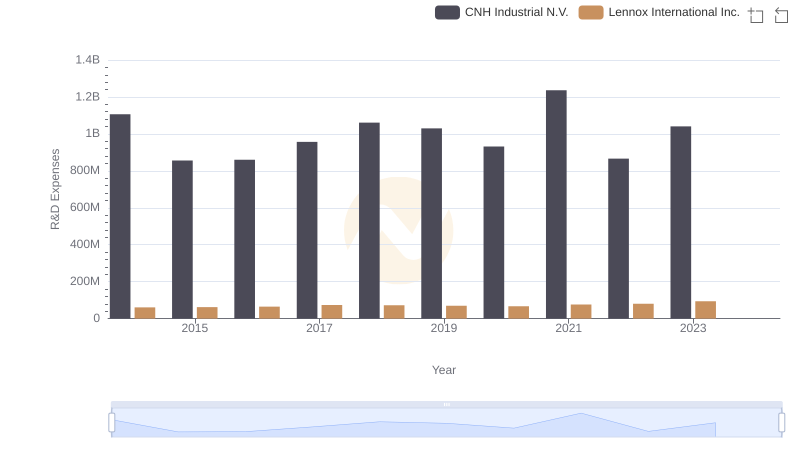
Comparing Innovation Spending: Lennox International Inc. and CNH Industrial N.V.
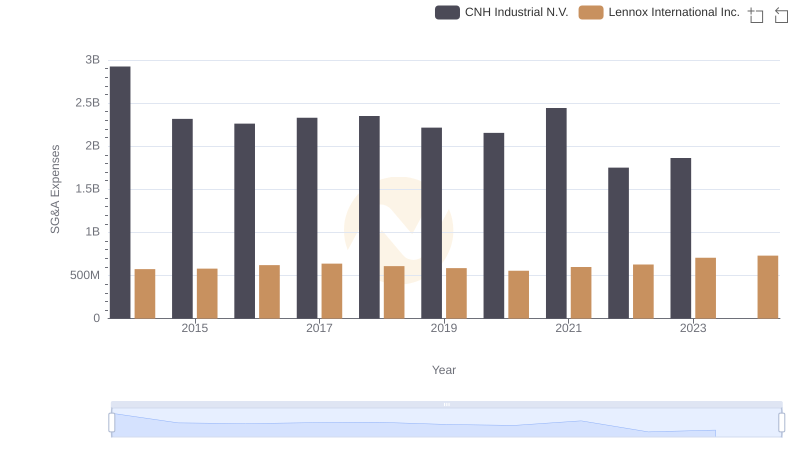
Breaking Down SG&A Expenses: Lennox International Inc. vs CNH Industrial N.V.
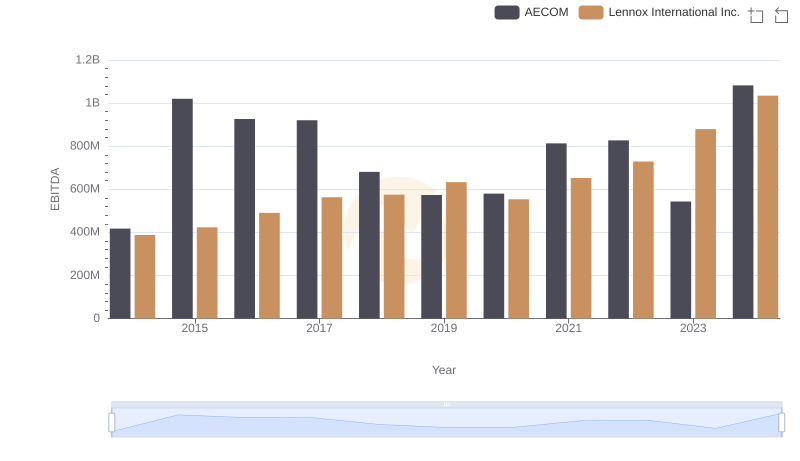
EBITDA Analysis: Evaluating Lennox International Inc. Against AECOM
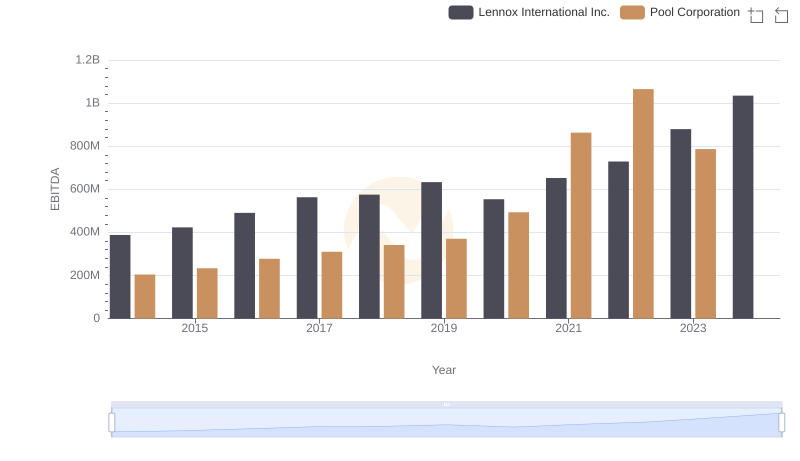
EBITDA Analysis: Evaluating Lennox International Inc. Against Pool Corporation
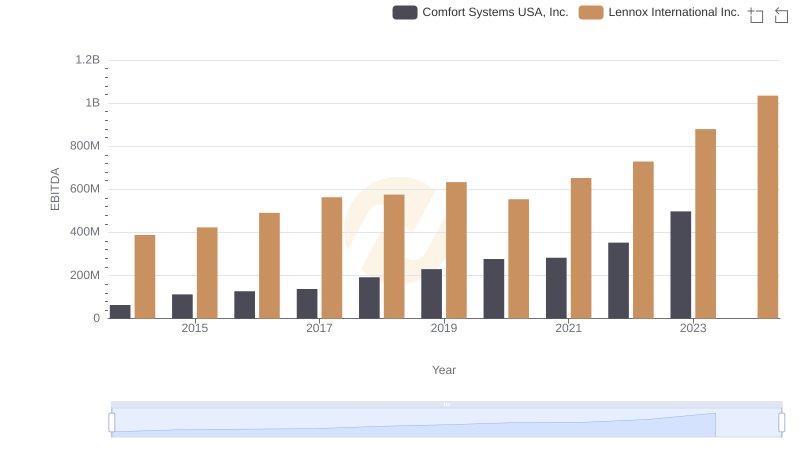
A Professional Review of EBITDA: Lennox International Inc. Compared to Comfort Systems USA, Inc.
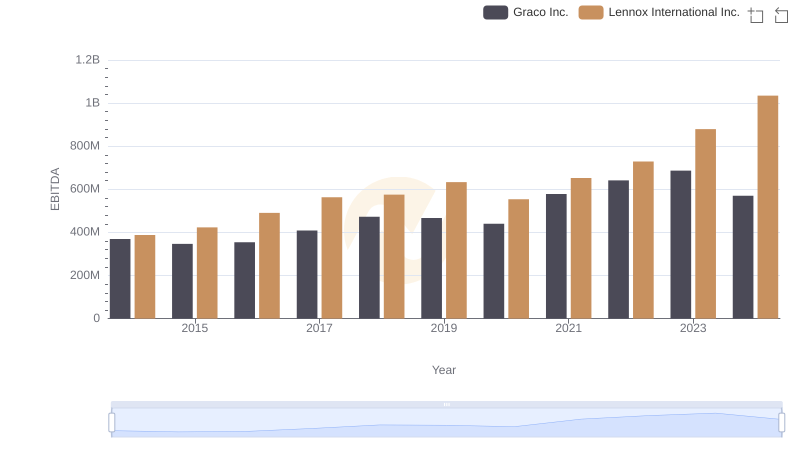
Comparative EBITDA Analysis: Lennox International Inc. vs Graco Inc.

Professional EBITDA Benchmarking: Lennox International Inc. vs Stanley Black & Decker, Inc.
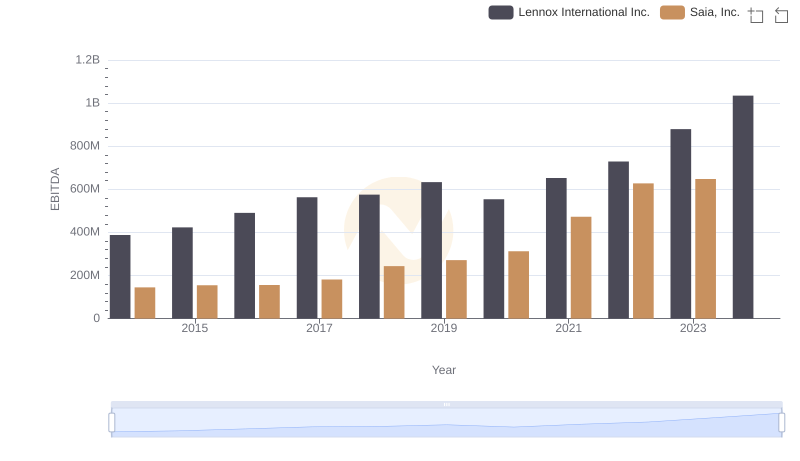
Comprehensive EBITDA Comparison: Lennox International Inc. vs Saia, Inc.
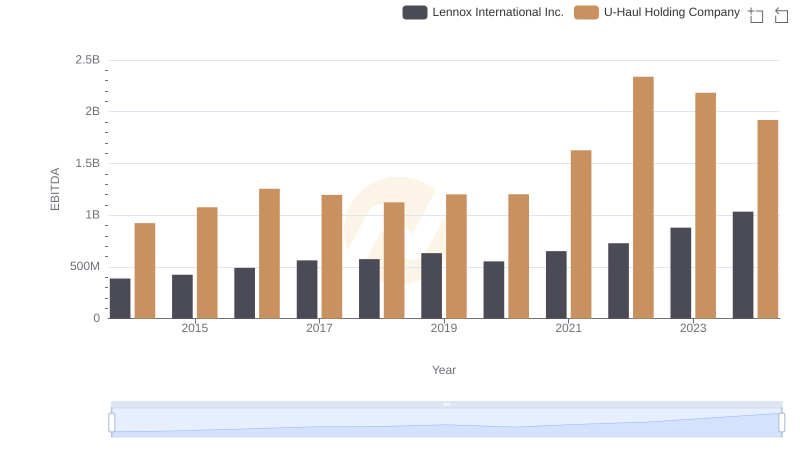
A Professional Review of EBITDA: Lennox International Inc. Compared to U-Haul Holding Company