| __timestamp | Fiserv, Inc. | Intuit Inc. |
|---|---|---|
| Wednesday, January 1, 2014 | 2881000000 | 668000000 |
| Thursday, January 1, 2015 | 2909000000 | 725000000 |
| Friday, January 1, 2016 | 2959000000 | 752000000 |
| Sunday, January 1, 2017 | 3024000000 | 809000000 |
| Monday, January 1, 2018 | 3069000000 | 977000000 |
| Tuesday, January 1, 2019 | 5309000000 | 1167000000 |
| Wednesday, January 1, 2020 | 7812000000 | 1378000000 |
| Friday, January 1, 2021 | 8128000000 | 1683000000 |
| Saturday, January 1, 2022 | 7992000000 | 2406000000 |
| Sunday, January 1, 2023 | 7670000000 | 3143000000 |
| Monday, January 1, 2024 | 0 | 3465000000 |
Unleashing the power of data
In the ever-evolving landscape of financial technology, understanding the cost dynamics of industry leaders like Intuit Inc. and Fiserv, Inc. is crucial. Over the past decade, Fiserv's cost of revenue has seen a significant increase, peaking in 2021 with a staggering 182% rise from 2014. Meanwhile, Intuit Inc. has experienced a more gradual growth, with its cost of revenue increasing by approximately 418% from 2014 to 2023.
The data for 2024 is incomplete, highlighting the need for continuous monitoring to capture emerging trends.
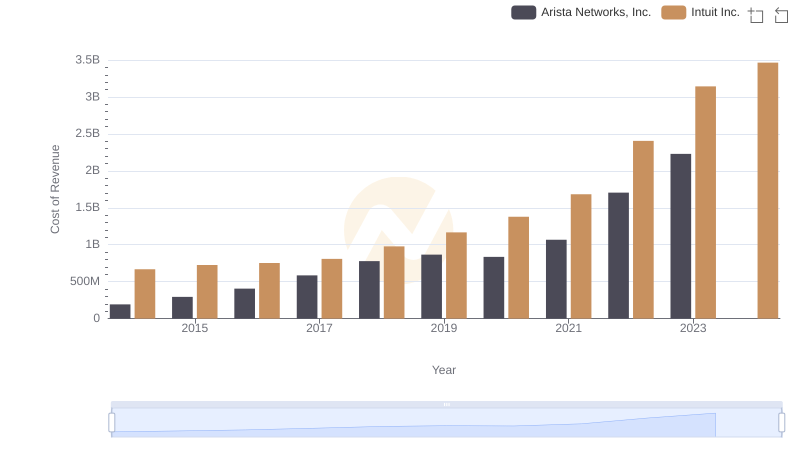
Cost of Revenue: Key Insights for Intuit Inc. and Arista Networks, Inc.
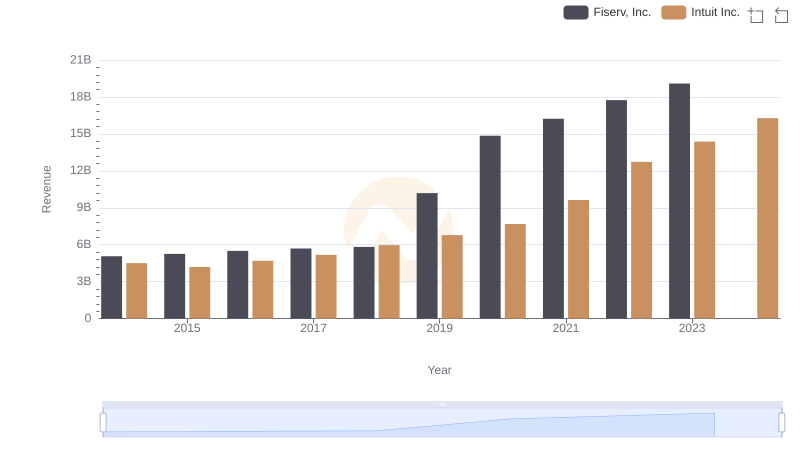
Comparing Revenue Performance: Intuit Inc. or Fiserv, Inc.?

Annual Revenue Comparison: Intuit Inc. vs Fiserv, Inc.
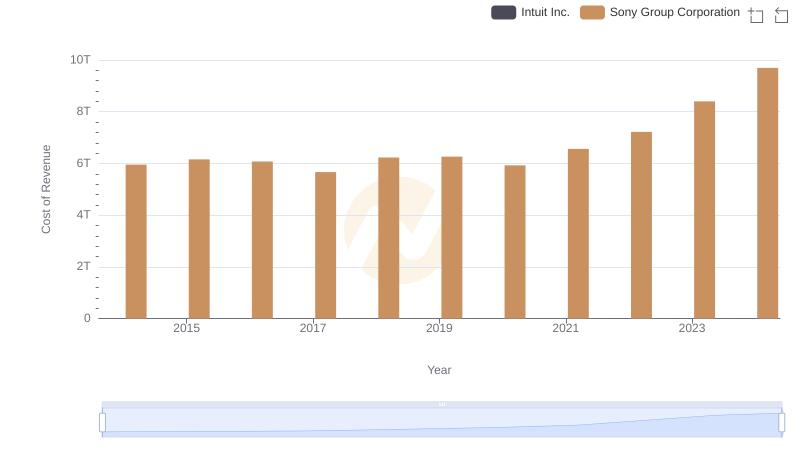
Cost of Revenue Trends: Intuit Inc. vs Sony Group Corporation
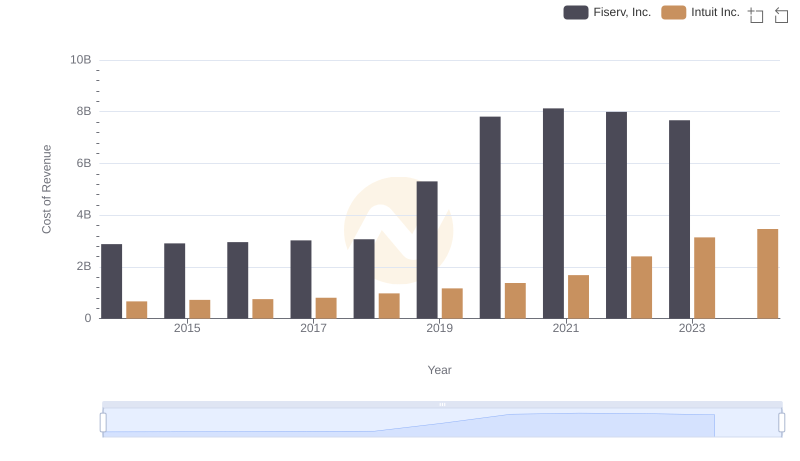
Cost Insights: Breaking Down Intuit Inc. and Fiserv, Inc.'s Expenses
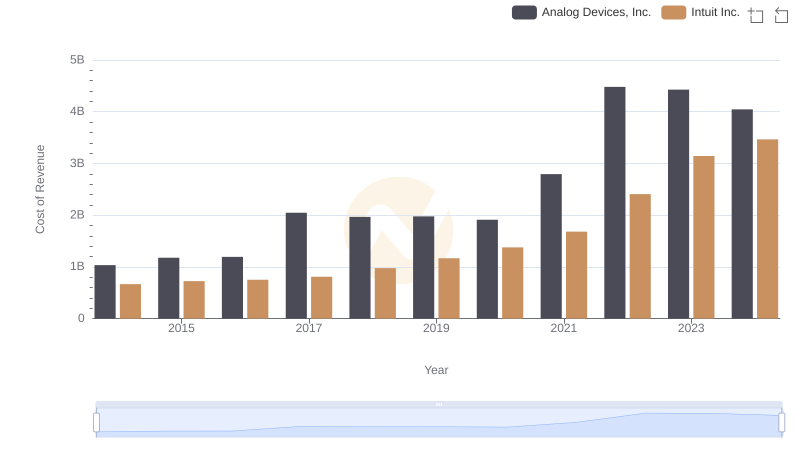
Cost Insights: Breaking Down Intuit Inc. and Analog Devices, Inc.'s Expenses
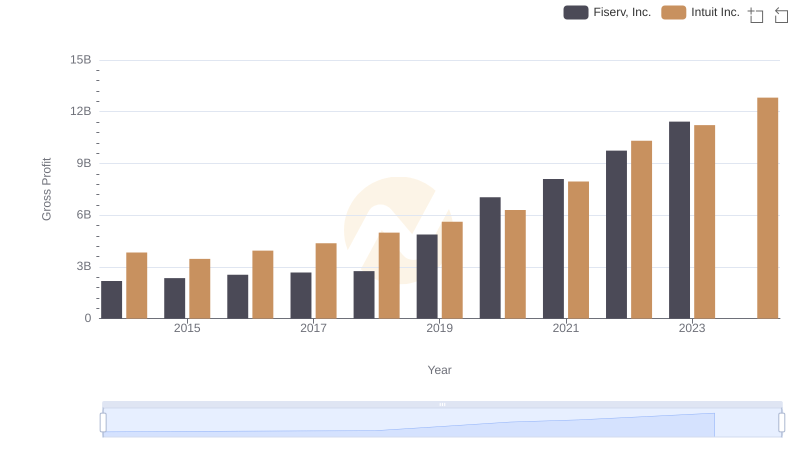
Who Generates Higher Gross Profit? Intuit Inc. or Fiserv, Inc.

Intuit Inc. vs Fiserv, Inc.: A Gross Profit Performance Breakdown

Cost Management Insights: SG&A Expenses for Intuit Inc. and Fiserv, Inc.
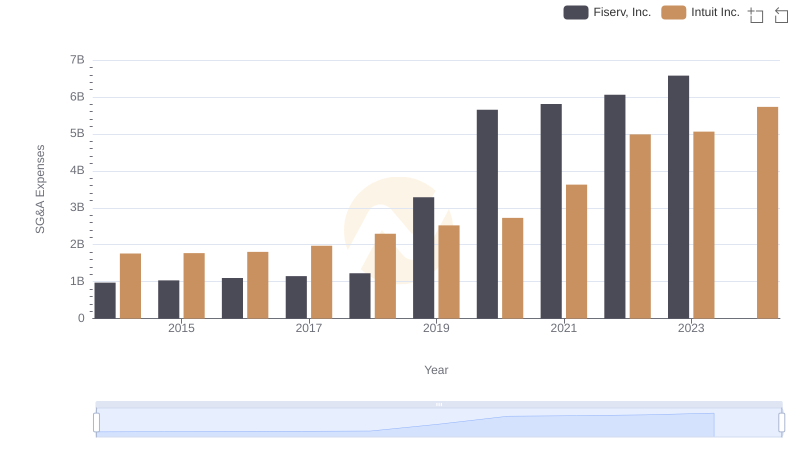
Intuit Inc. or Fiserv, Inc.: Who Manages SG&A Costs Better?
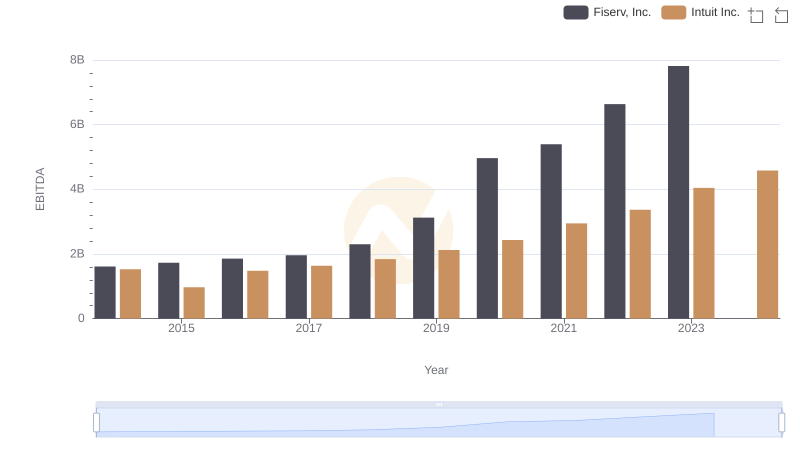
Comprehensive EBITDA Comparison: Intuit Inc. vs Fiserv, Inc.

Comprehensive EBITDA Comparison: Intuit Inc. vs Fiserv, Inc.