| __timestamp | Intuit Inc. | Lam Research Corporation |
|---|---|---|
| Wednesday, January 1, 2014 | 668000000 | 2599828000 |
| Thursday, January 1, 2015 | 725000000 | 2974976000 |
| Friday, January 1, 2016 | 752000000 | 3266971000 |
| Sunday, January 1, 2017 | 809000000 | 4410261000 |
| Monday, January 1, 2018 | 977000000 | 5911966000 |
| Tuesday, January 1, 2019 | 1167000000 | 5295100000 |
| Wednesday, January 1, 2020 | 1378000000 | 5436043000 |
| Friday, January 1, 2021 | 1683000000 | 7820844000 |
| Saturday, January 1, 2022 | 2406000000 | 9355232000 |
| Sunday, January 1, 2023 | 3143000000 | 9651591000 |
| Monday, January 1, 2024 | 3465000000 | 7852595000 |
Cracking the code
In the ever-evolving landscape of technology and finance, understanding the cost of revenue is crucial for investors and analysts alike. Over the past decade, Intuit Inc. and Lam Research Corporation have shown distinct trajectories in their cost of revenue. From 2014 to 2023, Intuit's cost of revenue surged by over 400%, reflecting its expanding operations and market reach. In contrast, Lam Research Corporation experienced a 270% increase, peaking in 2023 before a slight dip in 2024. This divergence highlights the different growth strategies and market conditions faced by these industry giants. Intuit's steady climb suggests a robust adaptation to market demands, while Lam's fluctuations may indicate a response to the cyclical nature of the semiconductor industry. As we look to the future, these trends offer valuable insights into the financial health and strategic directions of these companies.
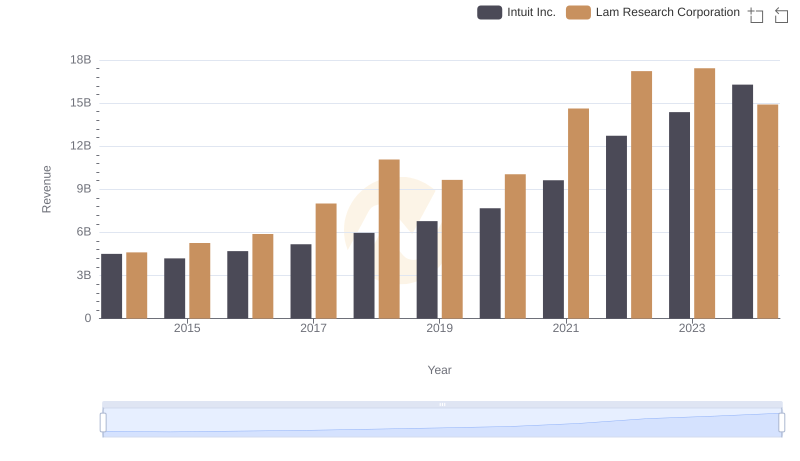
Revenue Insights: Intuit Inc. and Lam Research Corporation Performance Compared
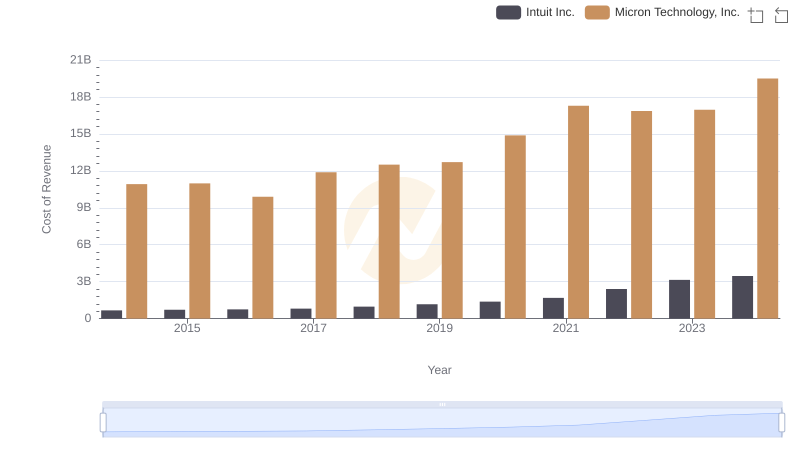
Cost of Revenue Trends: Intuit Inc. vs Micron Technology, Inc.
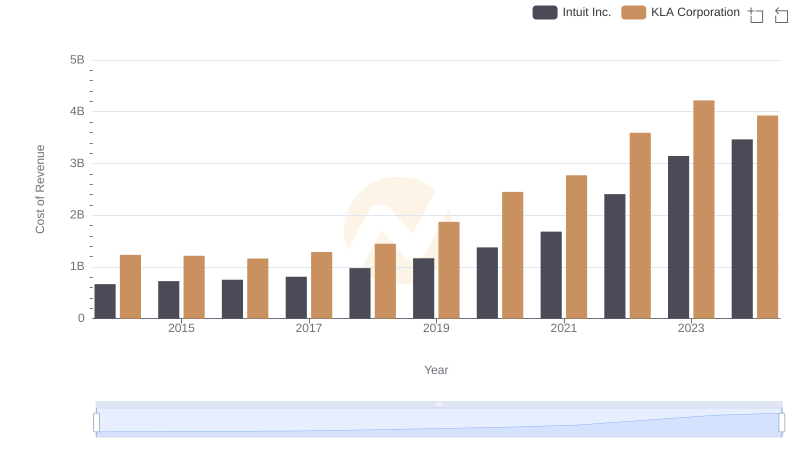
Cost of Revenue Trends: Intuit Inc. vs KLA Corporation
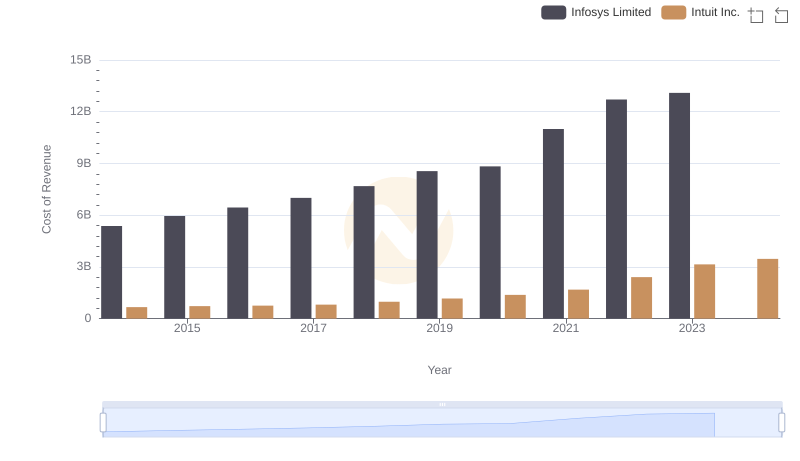
Comparing Cost of Revenue Efficiency: Intuit Inc. vs Infosys Limited
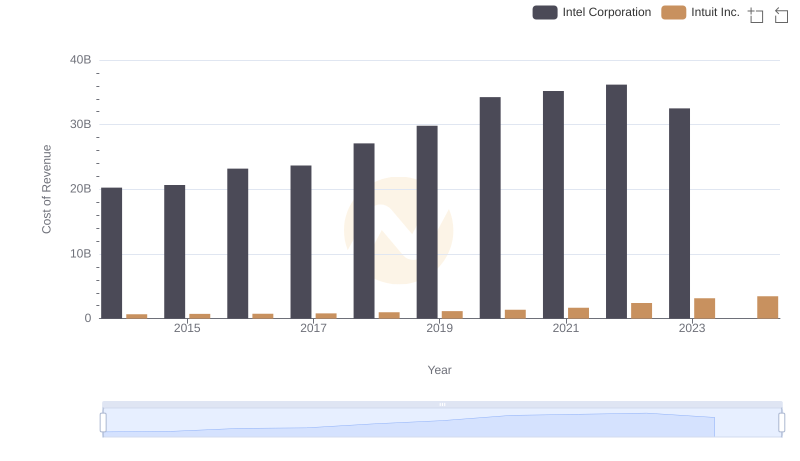
Intuit Inc. vs Intel Corporation: Efficiency in Cost of Revenue Explored
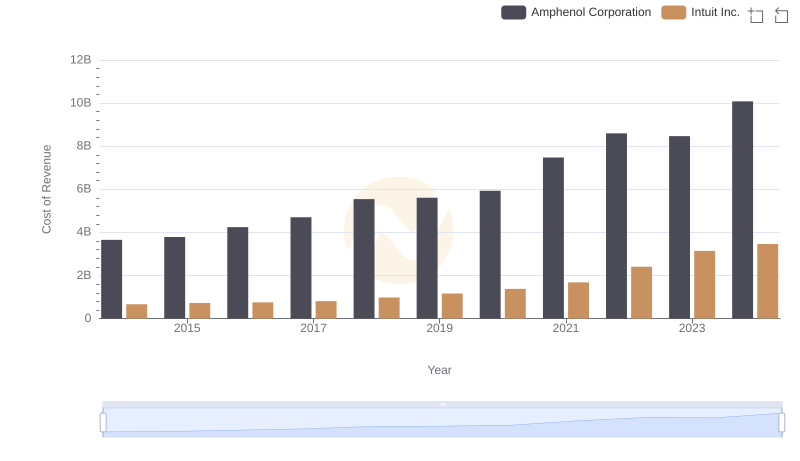
Analyzing Cost of Revenue: Intuit Inc. and Amphenol Corporation
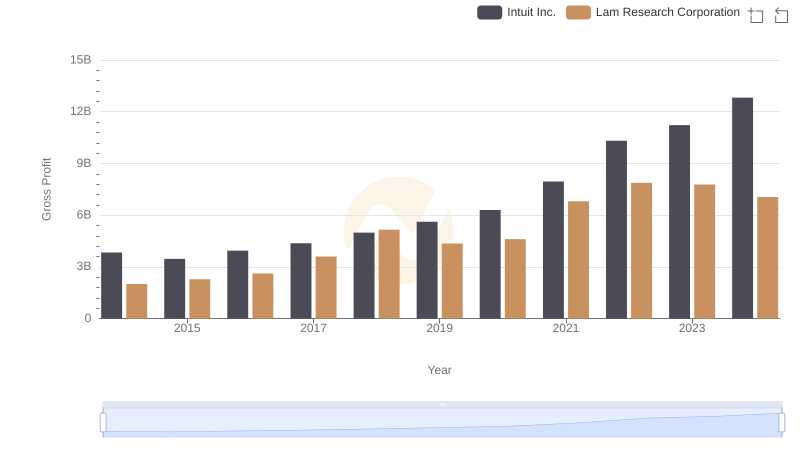
Gross Profit Comparison: Intuit Inc. and Lam Research Corporation Trends
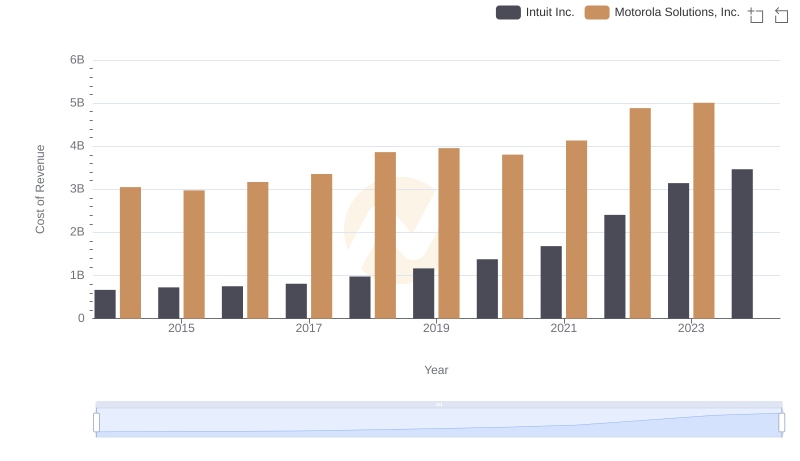
Cost Insights: Breaking Down Intuit Inc. and Motorola Solutions, Inc.'s Expenses
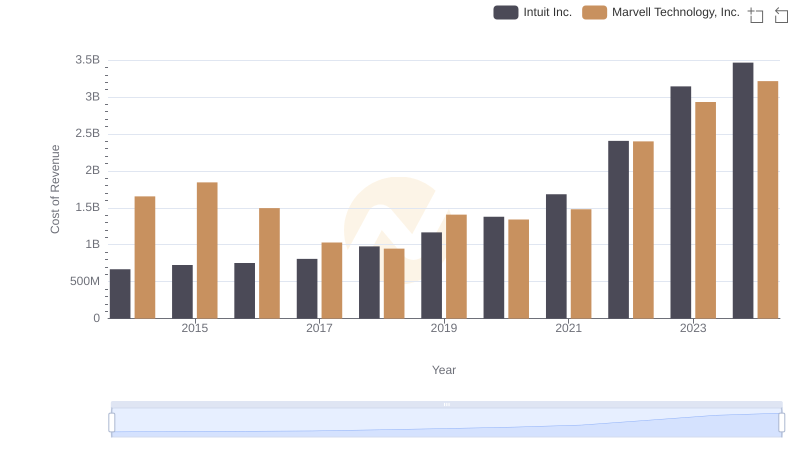
Cost of Revenue Comparison: Intuit Inc. vs Marvell Technology, Inc.
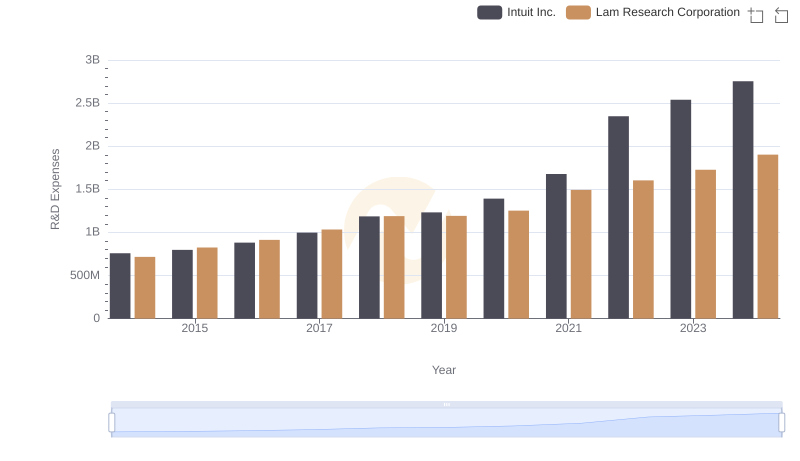
Analyzing R&D Budgets: Intuit Inc. vs Lam Research Corporation
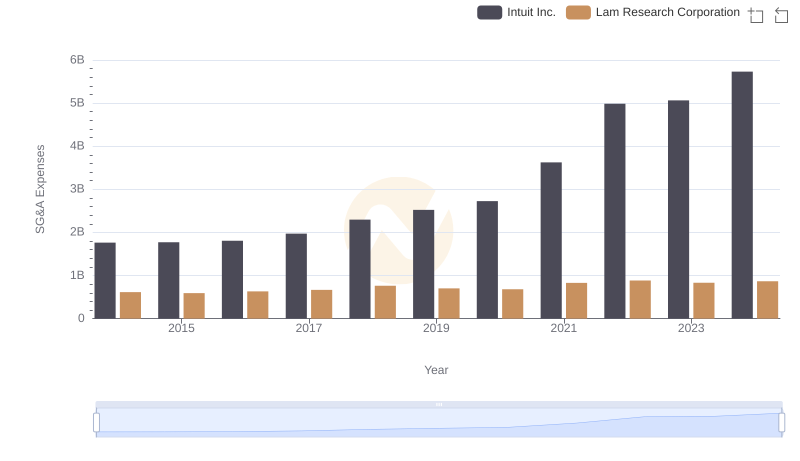
Comparing SG&A Expenses: Intuit Inc. vs Lam Research Corporation Trends and Insights
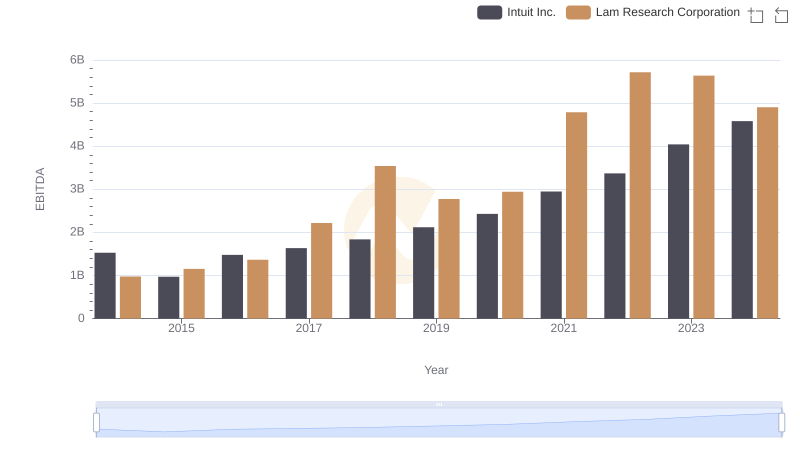
Intuit Inc. and Lam Research Corporation: A Detailed Examination of EBITDA Performance