| __timestamp | Fiserv, Inc. | Intuit Inc. |
|---|---|---|
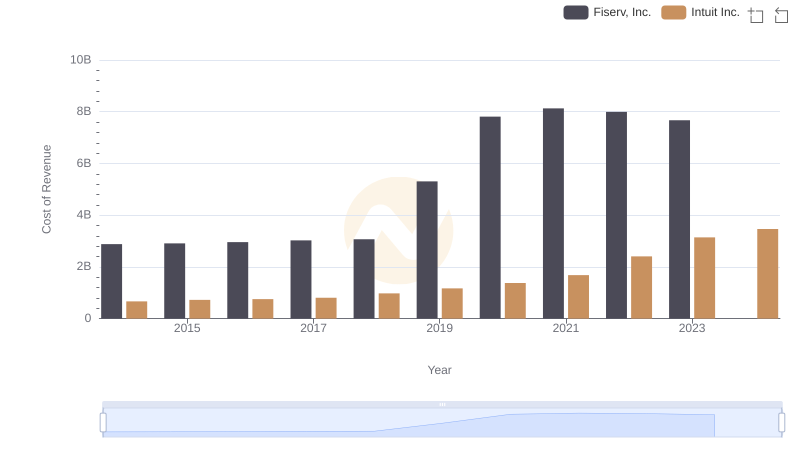
| Wednesday, January 1, 2014 | 2881000000 | 668000000 |
| Thursday, January 1, 2015 | 2909000000 | 725000000 |
| Friday, January 1, 2016 | 2959000000 | 752000000 |
| Sunday, January 1, 2017 | 3024000000 | 809000000 |
| Monday, January 1, 2018 | 3069000000 | 977000000 |
| Tuesday, January 1, 2019 | 5309000000 | 1167000000 |
| Wednesday, January 1, 2020 | 7812000000 | 1378000000 |
| Friday, January 1, 2021 | 8128000000 | 1683000000 |
| Saturday, January 1, 2022 | 7992000000 | 2406000000 |
| Sunday, January 1, 2023 | 7670000000 | 3143000000 |
| Monday, January 1, 2024 | 0 | 3465000000 |
Cracking the code
In the ever-evolving landscape of financial technology, understanding the cost dynamics of industry leaders like Intuit Inc. and Fiserv, Inc. is crucial. Over the past decade, Fiserv's cost of revenue has surged by approximately 166%, peaking in 2021. This reflects its aggressive expansion and integration strategies. Meanwhile, Intuit Inc. has seen a more modest increase of around 418% from 2014 to 2023, highlighting its steady growth and innovation in financial software solutions.
These insights underscore the strategic financial maneuvers of these giants, shaping the fintech industry's future.
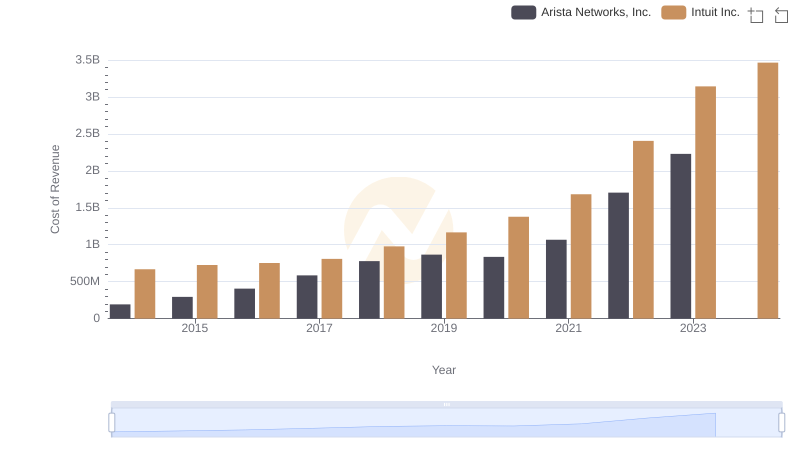
Cost of Revenue: Key Insights for Intuit Inc. and Arista Networks, Inc.
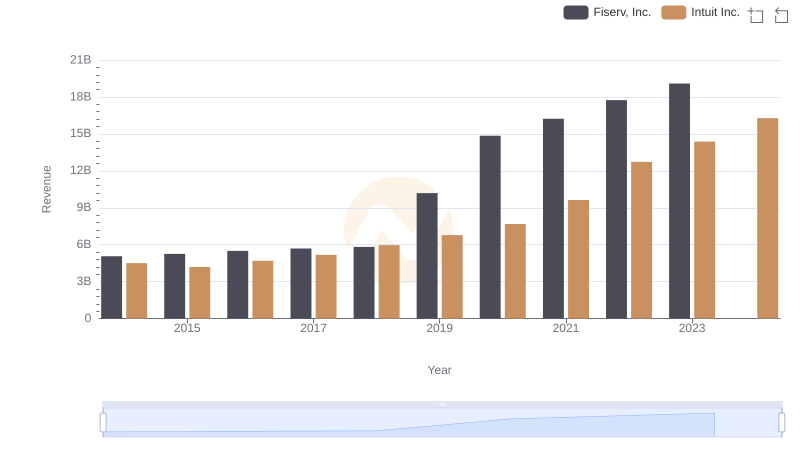
Comparing Revenue Performance: Intuit Inc. or Fiserv, Inc.?

Annual Revenue Comparison: Intuit Inc. vs Fiserv, Inc.
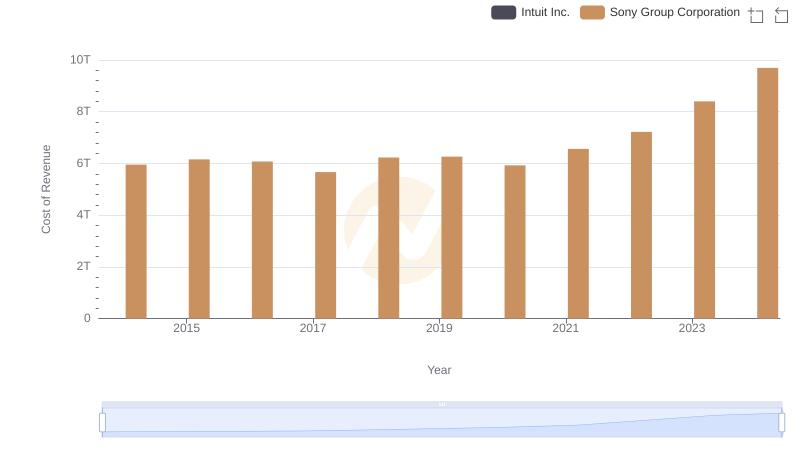
Cost of Revenue Trends: Intuit Inc. vs Sony Group Corporation
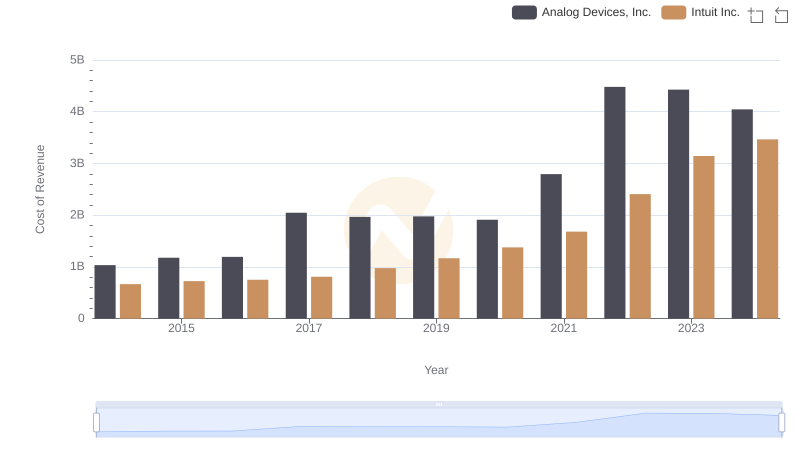
Cost Insights: Breaking Down Intuit Inc. and Analog Devices, Inc.'s Expenses
Cost Insights: Breaking Down Intuit Inc. and Fiserv, Inc.'s Expenses
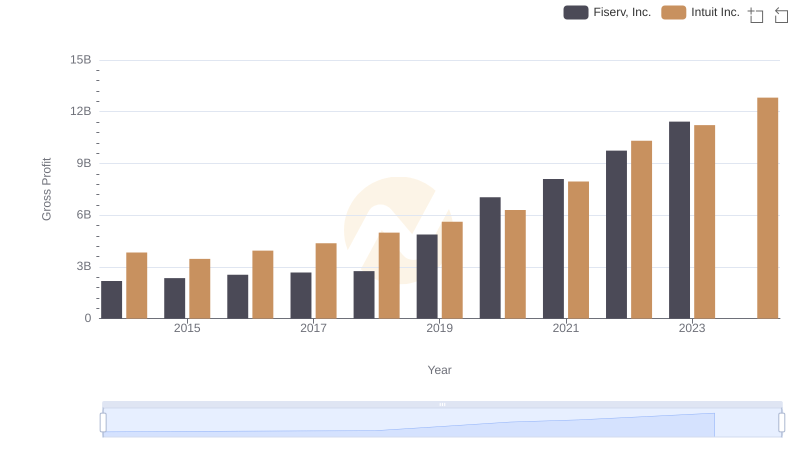
Who Generates Higher Gross Profit? Intuit Inc. or Fiserv, Inc.

Intuit Inc. vs Fiserv, Inc.: A Gross Profit Performance Breakdown

Cost Management Insights: SG&A Expenses for Intuit Inc. and Fiserv, Inc.
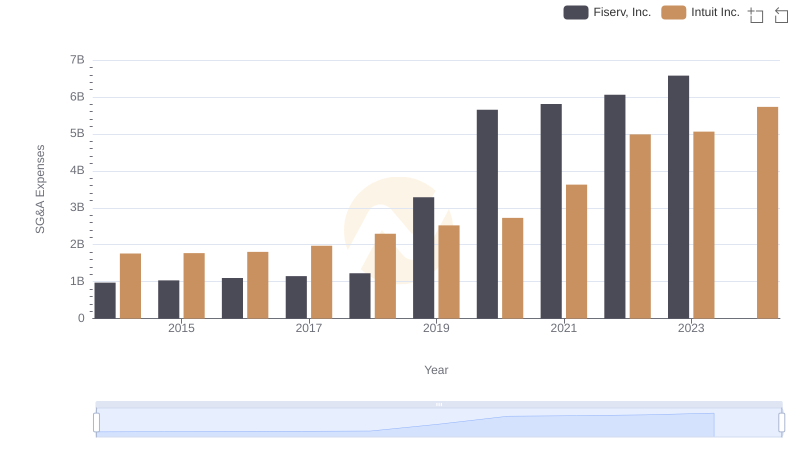
Intuit Inc. or Fiserv, Inc.: Who Manages SG&A Costs Better?
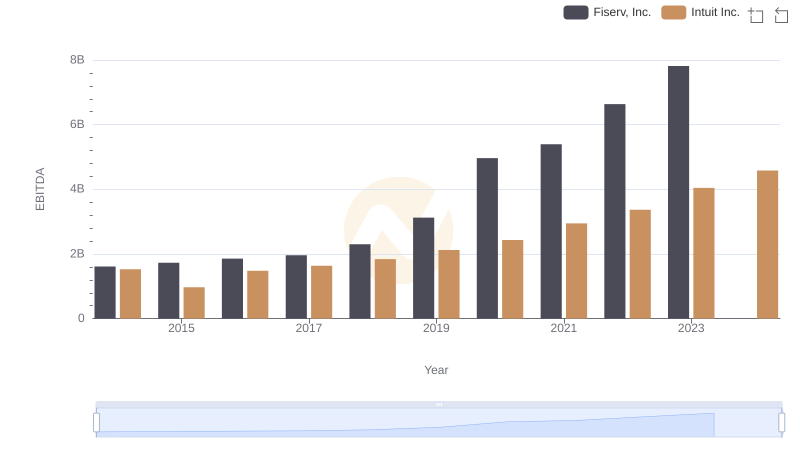
Comprehensive EBITDA Comparison: Intuit Inc. vs Fiserv, Inc.

Comprehensive EBITDA Comparison: Intuit Inc. vs Fiserv, Inc.