| __timestamp | Intuit Inc. | Palo Alto Networks, Inc. |
|---|---|---|
| Wednesday, January 1, 2014 | 668000000 | 159628000 |
| Thursday, January 1, 2015 | 725000000 | 251499000 |
| Friday, January 1, 2016 | 752000000 | 370000000 |
| Sunday, January 1, 2017 | 809000000 | 476600000 |
| Monday, January 1, 2018 | 977000000 | 645300000 |
| Tuesday, January 1, 2019 | 1167000000 | 808400000 |
| Wednesday, January 1, 2020 | 1378000000 | 999500000 |
| Friday, January 1, 2021 | 1683000000 | 1274900000 |
| Saturday, January 1, 2022 | 2406000000 | 1718700000 |
| Sunday, January 1, 2023 | 3143000000 | 1909700000 |
| Monday, January 1, 2024 | 3465000000 | 2059199999 |
Unlocking the unknown
In the ever-evolving landscape of technology, understanding cost structures is crucial for investors and analysts alike. Over the past decade, Intuit Inc. and Palo Alto Networks, Inc. have demonstrated significant growth in their cost of revenue, reflecting their expanding operations and market reach. From 2014 to 2024, Intuit's cost of revenue surged by over 400%, while Palo Alto Networks saw an impressive increase of nearly 1,200%. This growth underscores the companies' strategic investments in innovation and infrastructure to maintain competitive edges in their respective fields. Notably, Intuit's cost of revenue consistently outpaced Palo Alto Networks, highlighting its larger scale of operations. As we look to the future, these trends offer valuable insights into the financial health and strategic priorities of these tech giants.
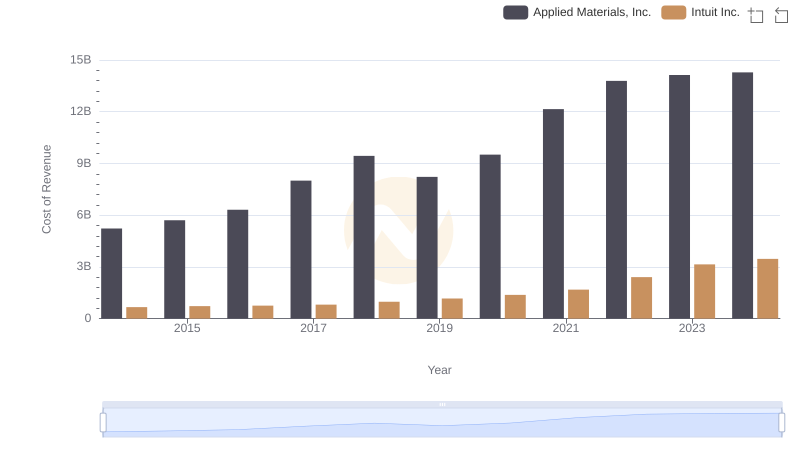
Cost of Revenue Comparison: Intuit Inc. vs Applied Materials, Inc.

Cost Insights: Breaking Down Intuit Inc. and Shopify Inc.'s Expenses
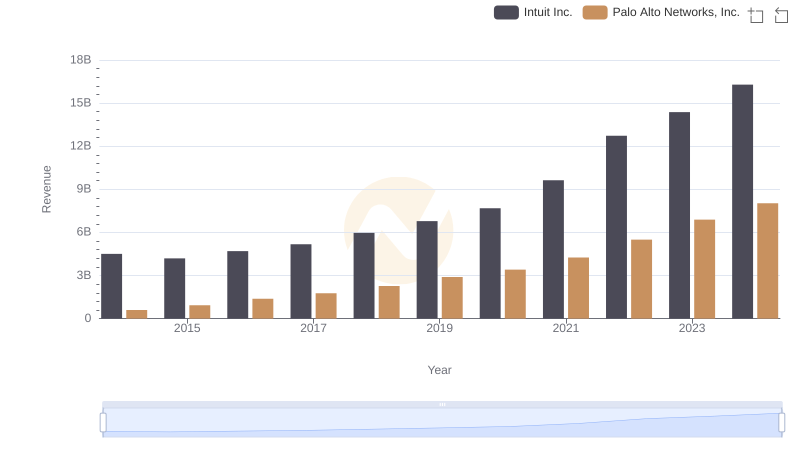
Breaking Down Revenue Trends: Intuit Inc. vs Palo Alto Networks, Inc.
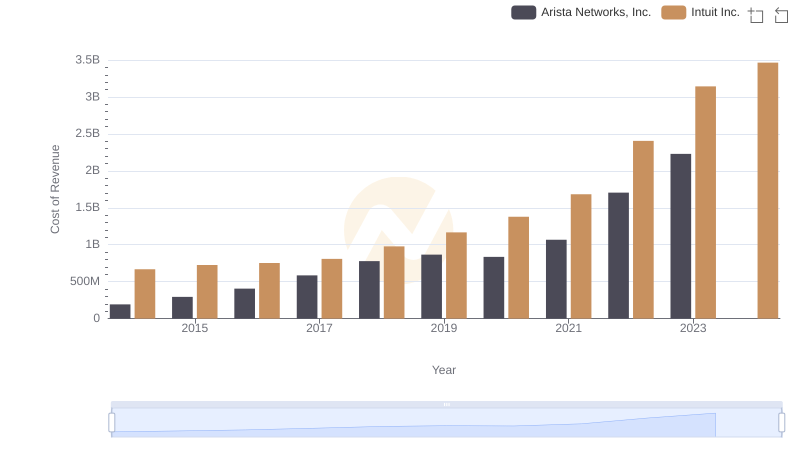
Cost of Revenue: Key Insights for Intuit Inc. and Arista Networks, Inc.
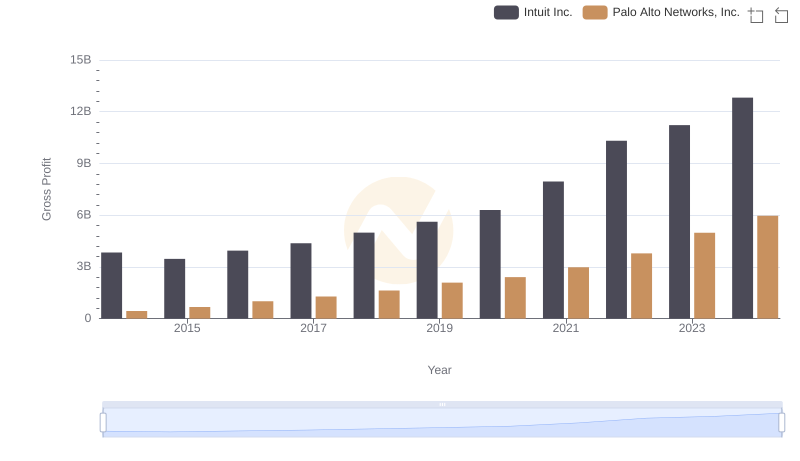
Who Generates Higher Gross Profit? Intuit Inc. or Palo Alto Networks, Inc.
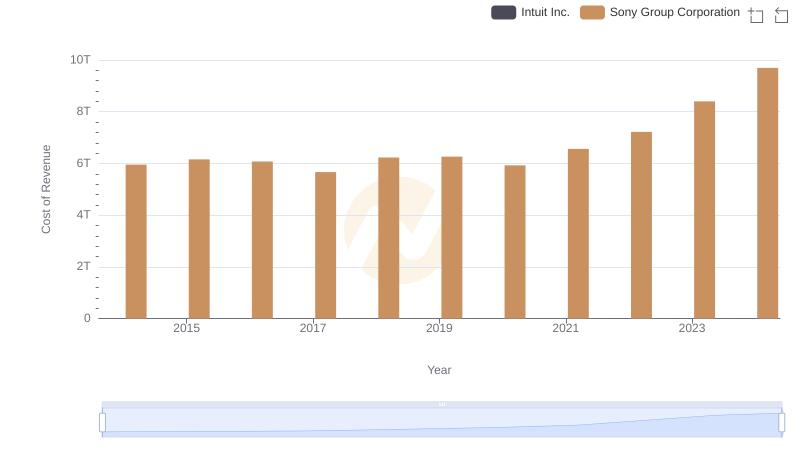
Cost of Revenue Trends: Intuit Inc. vs Sony Group Corporation
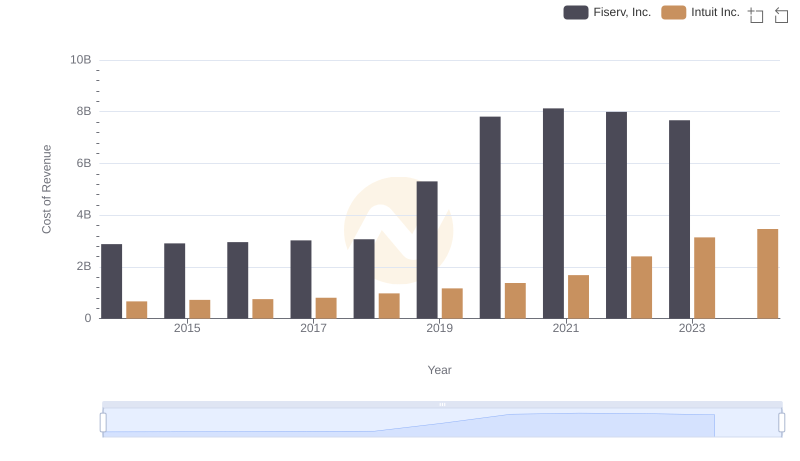
Cost Insights: Breaking Down Intuit Inc. and Fiserv, Inc.'s Expenses
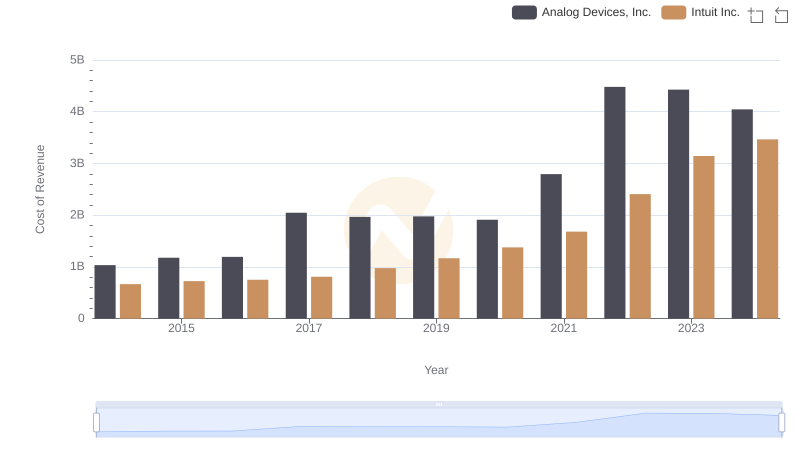
Cost Insights: Breaking Down Intuit Inc. and Analog Devices, Inc.'s Expenses

Cost Insights: Breaking Down Intuit Inc. and Fiserv, Inc.'s Expenses
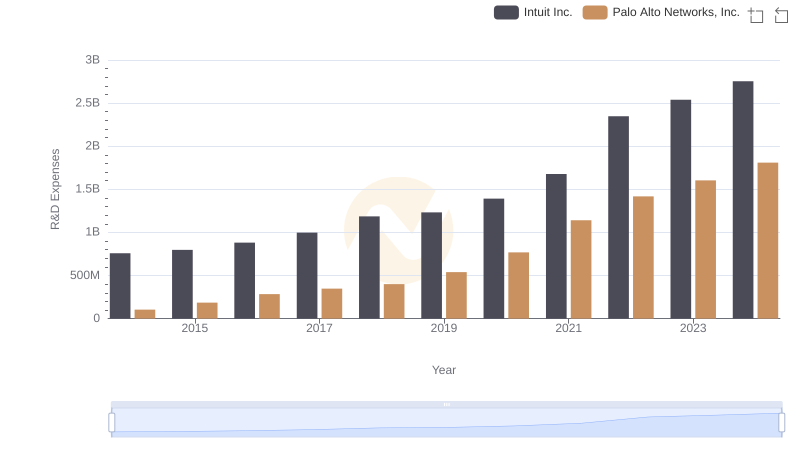
Comparing Innovation Spending: Intuit Inc. and Palo Alto Networks, Inc.
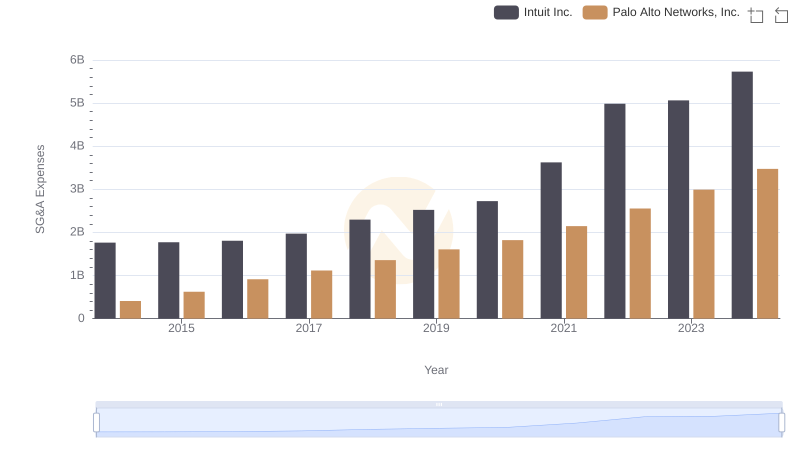
Comparing SG&A Expenses: Intuit Inc. vs Palo Alto Networks, Inc. Trends and Insights
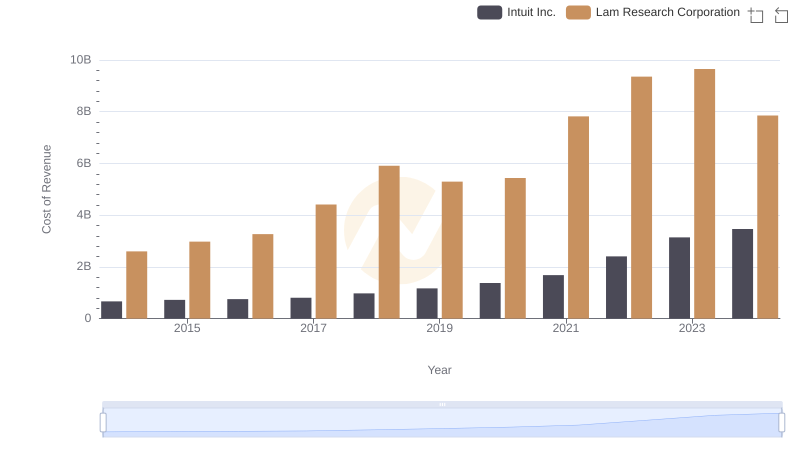
Analyzing Cost of Revenue: Intuit Inc. and Lam Research Corporation