| __timestamp | Arista Networks, Inc. | Intuit Inc. |
|---|---|---|
| Wednesday, January 1, 2014 | 192015000 | 668000000 |
| Thursday, January 1, 2015 | 294031000 | 725000000 |
| Friday, January 1, 2016 | 406051000 | 752000000 |
| Sunday, January 1, 2017 | 584417000 | 809000000 |
| Monday, January 1, 2018 | 777992000 | 977000000 |
| Tuesday, January 1, 2019 | 866368000 | 1167000000 |
| Wednesday, January 1, 2020 | 835626000 | 1378000000 |
| Friday, January 1, 2021 | 1067258000 | 1683000000 |
| Saturday, January 1, 2022 | 1705614000 | 2406000000 |
| Sunday, January 1, 2023 | 2229887000 | 3143000000 |
| Monday, January 1, 2024 | 2511843000 | 3465000000 |
Unleashing insights
In the ever-evolving landscape of technology, understanding cost structures is pivotal. From 2014 to 2023, Intuit Inc. and Arista Networks, Inc. have showcased intriguing trends in their cost of revenue. Intuit Inc. has seen a steady rise, with costs increasing by approximately 370% over the decade, peaking at $3.1 billion in 2023. This reflects its expanding market presence and investment in innovation.
Conversely, Arista Networks, Inc. has experienced a remarkable surge, with costs escalating by over 1,000%, reaching $2.2 billion in 2023. This growth underscores its aggressive expansion and scaling efforts. Notably, 2024 data for Arista Networks is missing, hinting at potential shifts or strategic pivots.
These insights offer a window into the strategic maneuvers of these tech giants, highlighting their commitment to growth and adaptation in a competitive market.
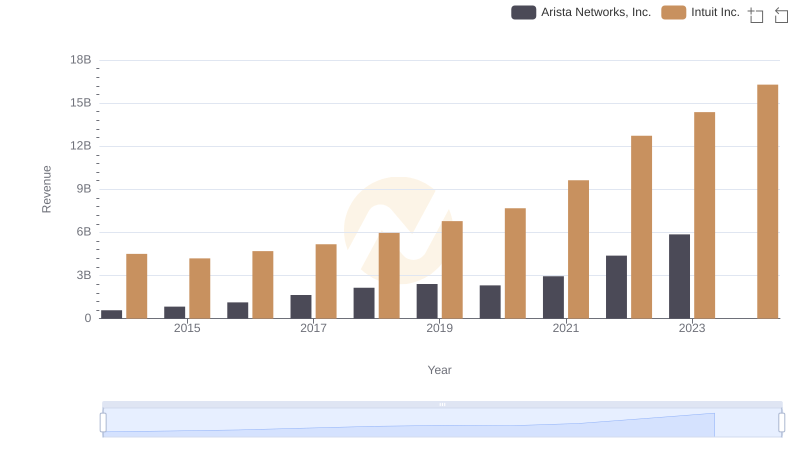
Annual Revenue Comparison: Intuit Inc. vs Arista Networks, Inc.
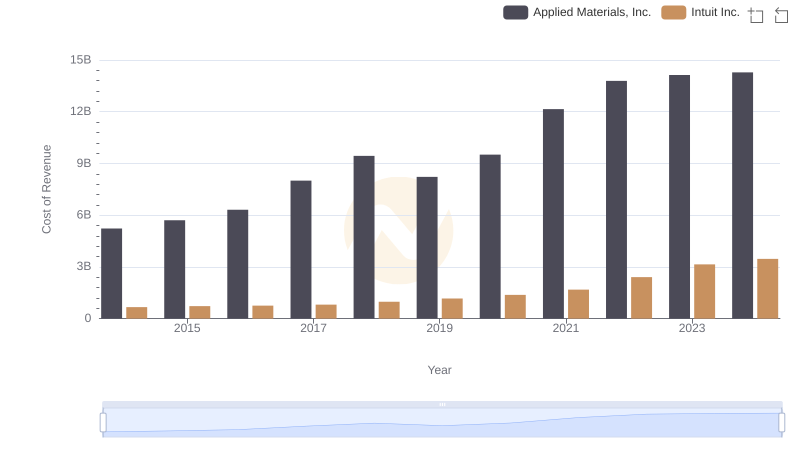
Cost of Revenue Comparison: Intuit Inc. vs Applied Materials, Inc.

Cost Insights: Breaking Down Intuit Inc. and Shopify Inc.'s Expenses
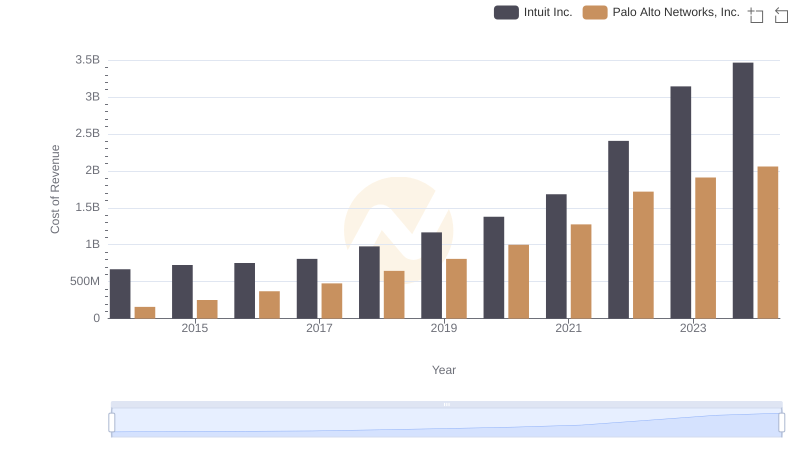
Cost Insights: Breaking Down Intuit Inc. and Palo Alto Networks, Inc.'s Expenses
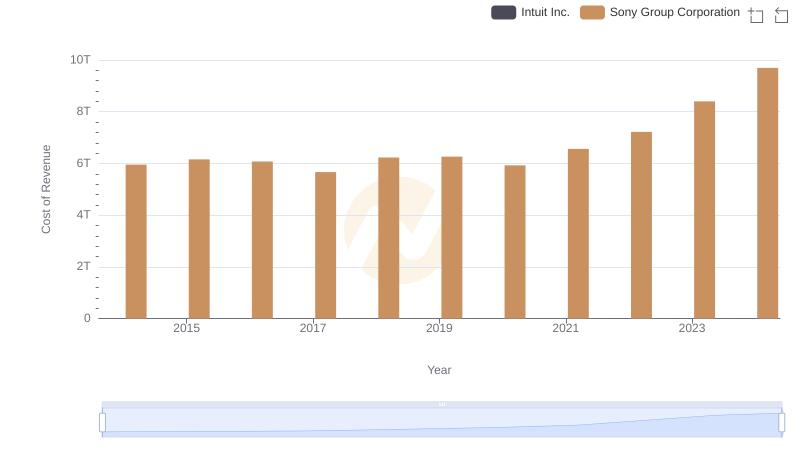
Cost of Revenue Trends: Intuit Inc. vs Sony Group Corporation
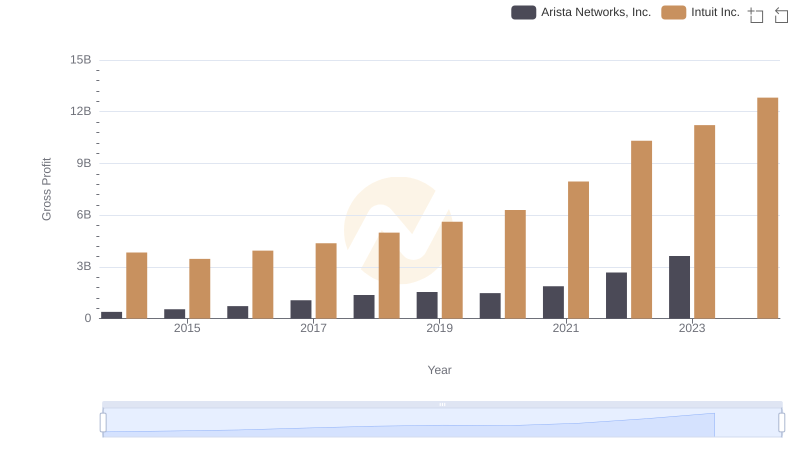
Intuit Inc. vs Arista Networks, Inc.: A Gross Profit Performance Breakdown
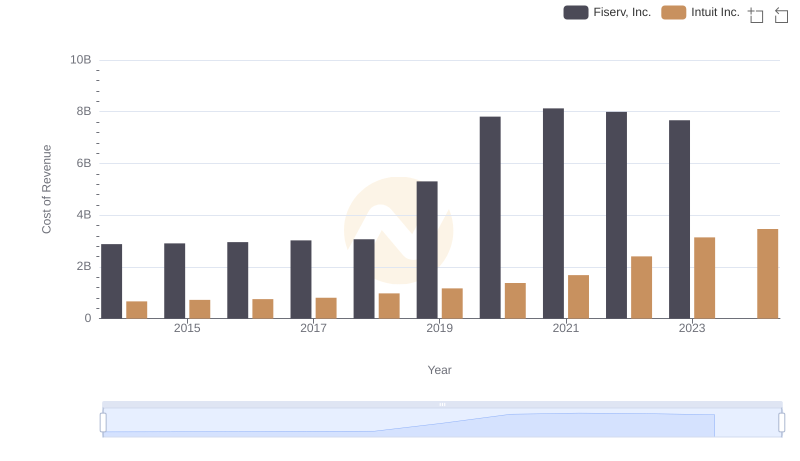
Cost Insights: Breaking Down Intuit Inc. and Fiserv, Inc.'s Expenses
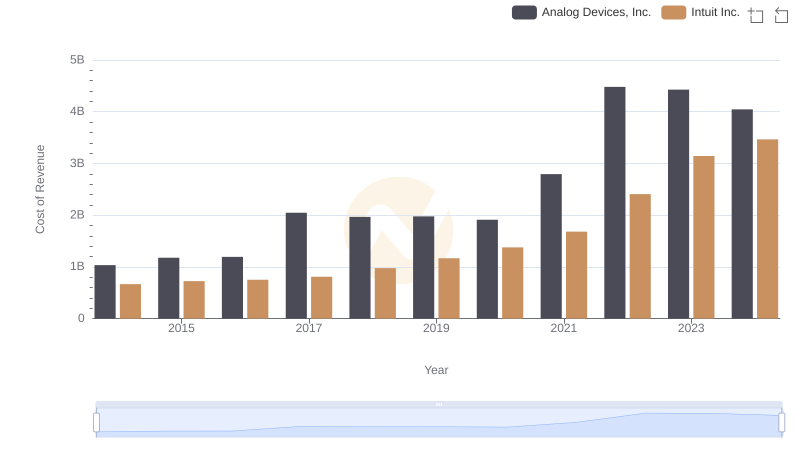
Cost Insights: Breaking Down Intuit Inc. and Analog Devices, Inc.'s Expenses

Cost Insights: Breaking Down Intuit Inc. and Fiserv, Inc.'s Expenses
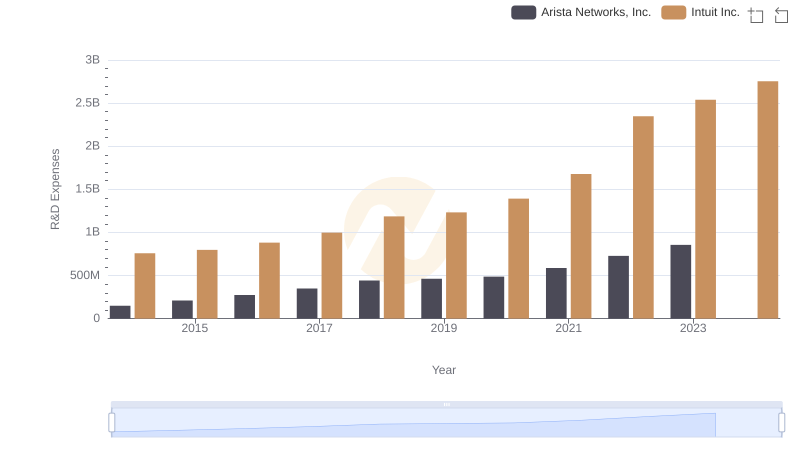
Intuit Inc. or Arista Networks, Inc.: Who Invests More in Innovation?
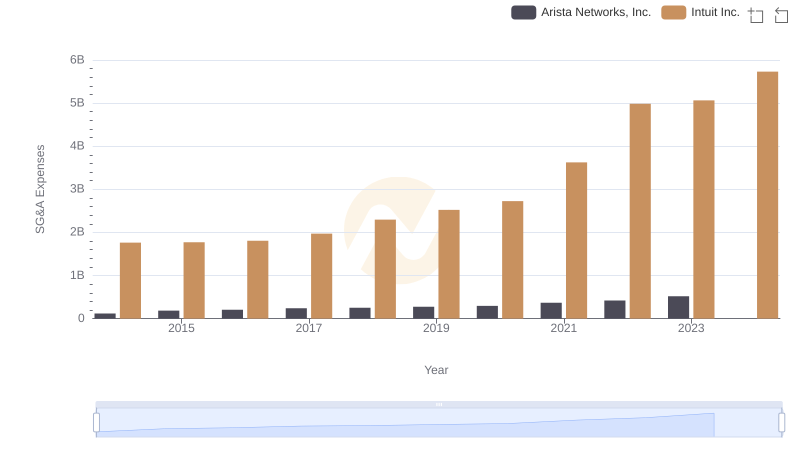
Operational Costs Compared: SG&A Analysis of Intuit Inc. and Arista Networks, Inc.
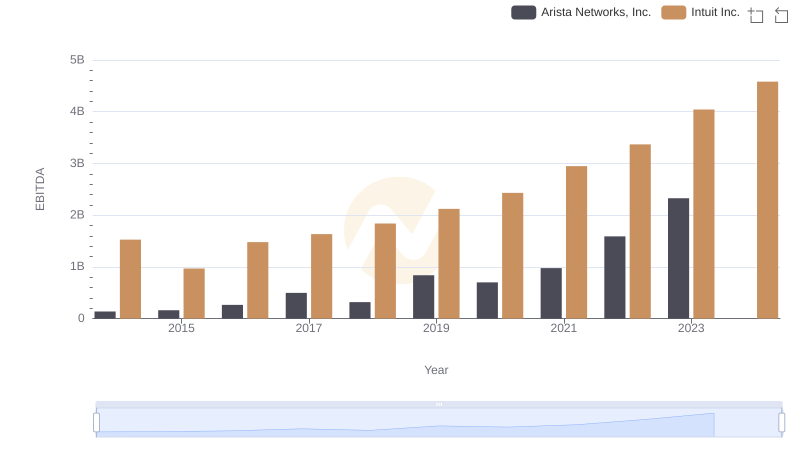
Intuit Inc. and Arista Networks, Inc.: A Detailed Examination of EBITDA Performance