| __timestamp | Axon Enterprise, Inc. | J.B. Hunt Transport Services, Inc. |
|---|---|---|
| Wednesday, January 1, 2014 | 62977000 | 5124095000 |
| Thursday, January 1, 2015 | 69245000 | 5041472000 |
| Friday, January 1, 2016 | 97709000 | 5369826000 |
| Sunday, January 1, 2017 | 136710000 | 5990275000 |
| Monday, January 1, 2018 | 161485000 | 7255657000 |
| Tuesday, January 1, 2019 | 223574000 | 7659003000 |
| Wednesday, January 1, 2020 | 264672000 | 8186697000 |
| Friday, January 1, 2021 | 322471000 | 10298483000 |
| Saturday, January 1, 2022 | 461297000 | 12341472000 |
| Sunday, January 1, 2023 | 608009000 | 10433277000 |
Unveiling the hidden dimensions of data
In the ever-evolving landscape of American business, understanding cost dynamics is crucial. Axon Enterprise, Inc. and J.B. Hunt Transport Services, Inc. offer a fascinating study in contrasts. From 2014 to 2023, Axon saw its cost of revenue grow nearly tenfold, reflecting its aggressive expansion and innovation in public safety technology. Meanwhile, J.B. Hunt, a titan in the transportation sector, experienced a steady 100% increase, underscoring its robust logistics operations.
Axon's cost of revenue surged from approximately $63 million in 2014 to over $608 million in 2023, a testament to its strategic investments. J.B. Hunt, starting at $5.1 billion, reached $10.4 billion, highlighting its dominance in freight transportation. This data not only showcases the companies' growth trajectories but also offers insights into their operational strategies and market positioning.
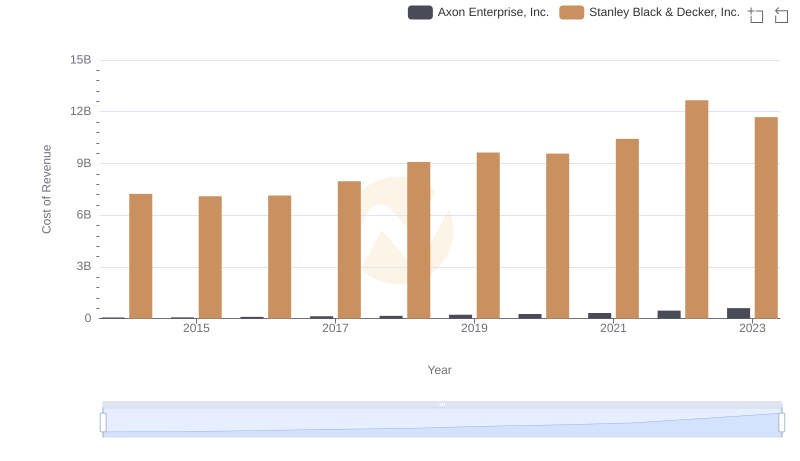
Cost of Revenue Trends: Axon Enterprise, Inc. vs Stanley Black & Decker, Inc.

Cost of Revenue: Key Insights for Axon Enterprise, Inc. and Snap-on Incorporated
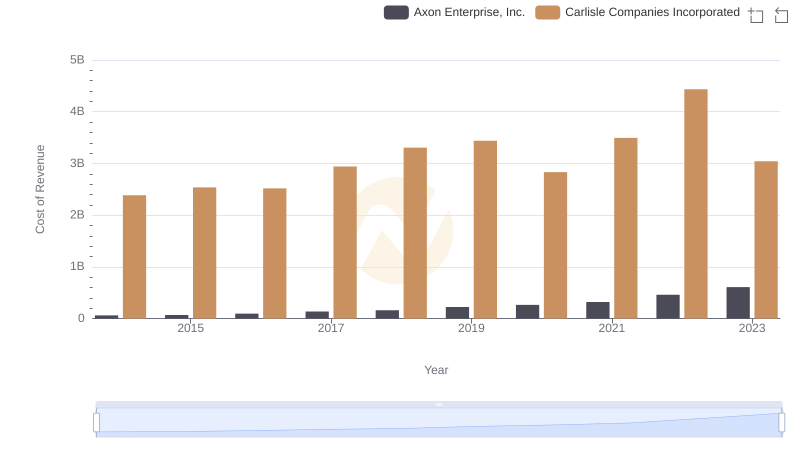
Cost Insights: Breaking Down Axon Enterprise, Inc. and Carlisle Companies Incorporated's Expenses
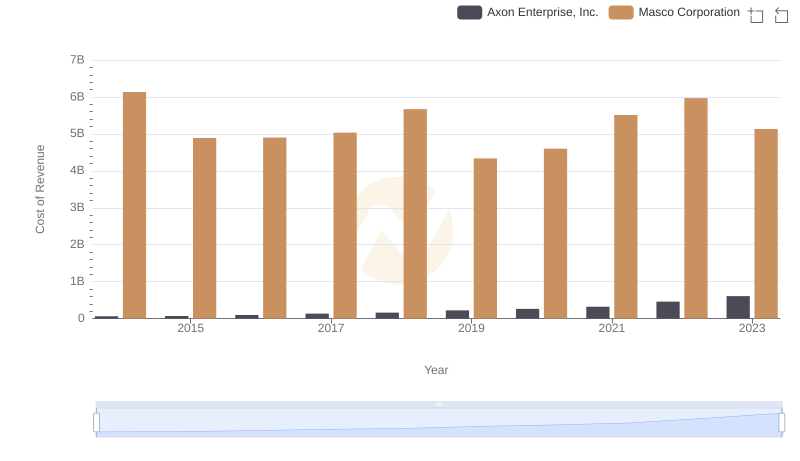
Cost of Revenue Comparison: Axon Enterprise, Inc. vs Masco Corporation
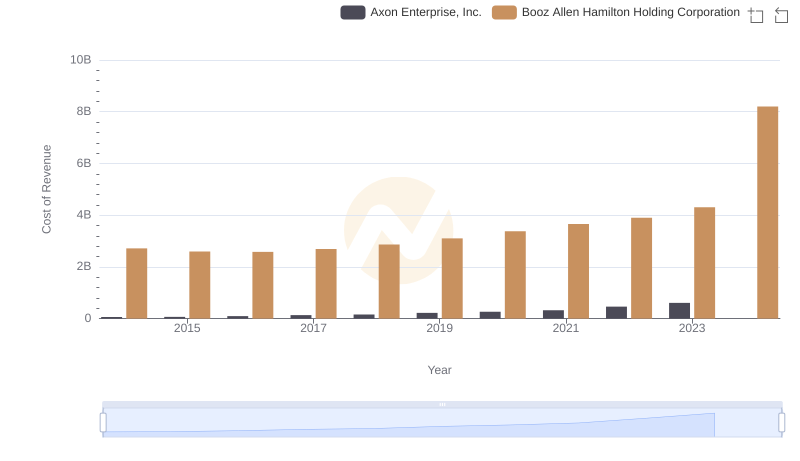
Cost of Revenue: Key Insights for Axon Enterprise, Inc. and Booz Allen Hamilton Holding Corporation
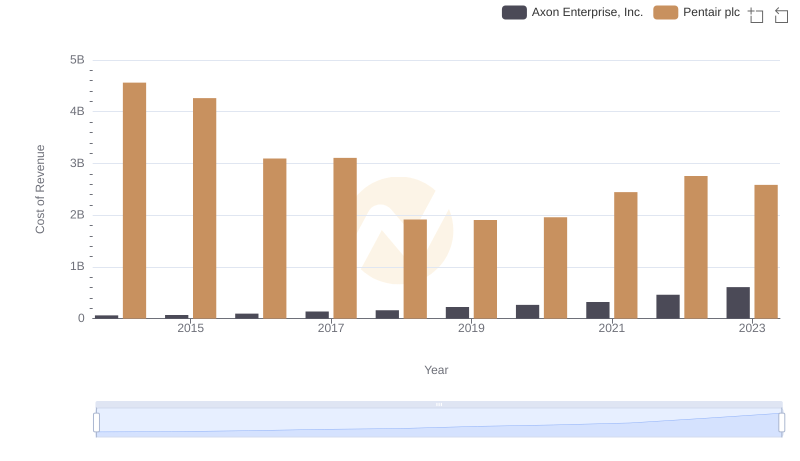
Axon Enterprise, Inc. vs Pentair plc: Efficiency in Cost of Revenue Explored
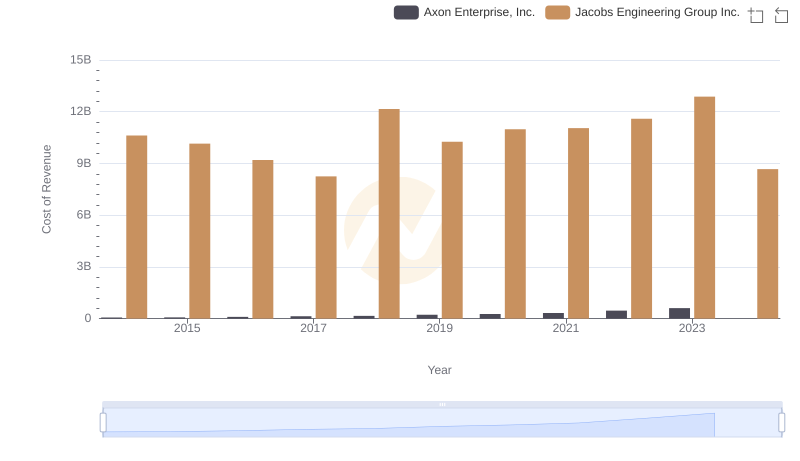
Analyzing Cost of Revenue: Axon Enterprise, Inc. and Jacobs Engineering Group Inc.
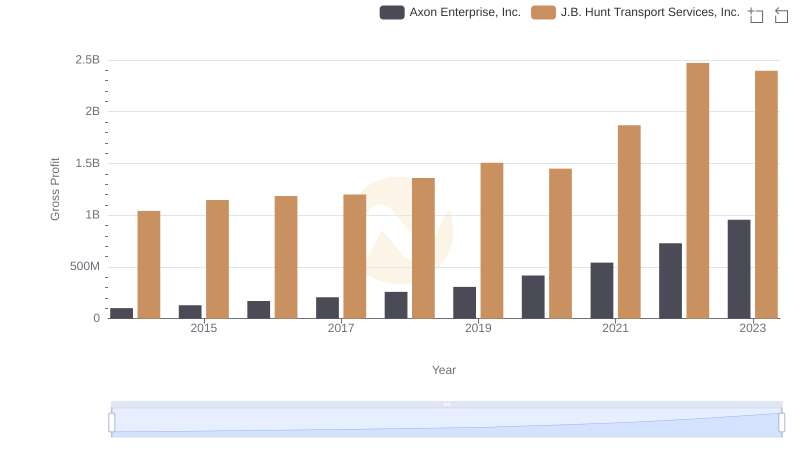
Gross Profit Comparison: Axon Enterprise, Inc. and J.B. Hunt Transport Services, Inc. Trends
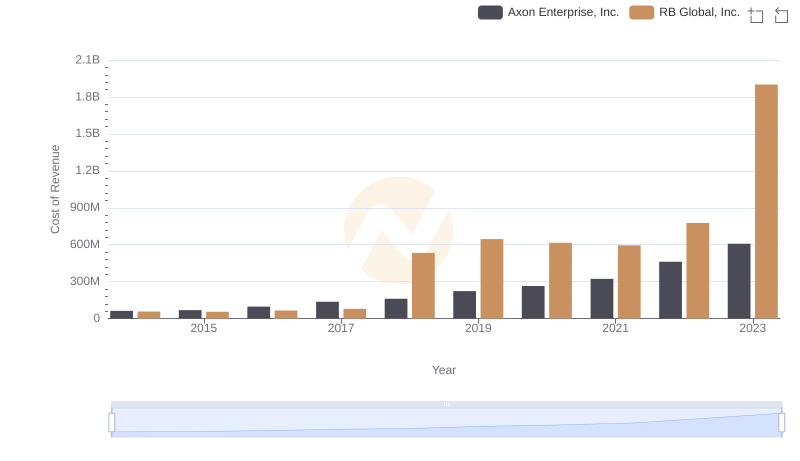
Cost Insights: Breaking Down Axon Enterprise, Inc. and RB Global, Inc.'s Expenses
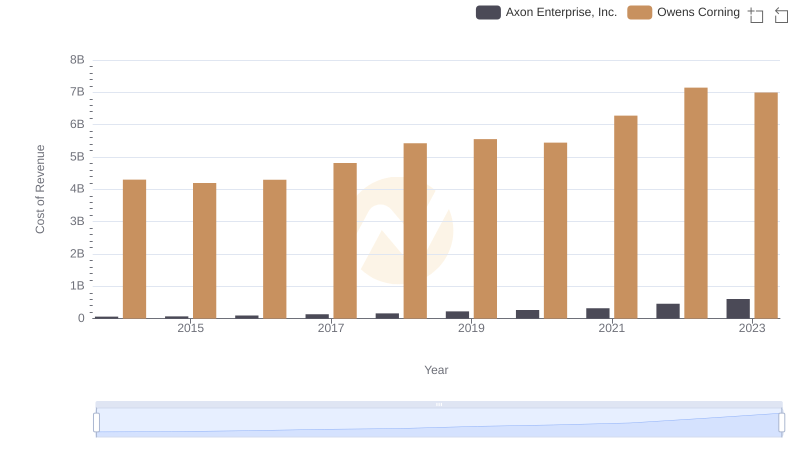
Cost of Revenue: Key Insights for Axon Enterprise, Inc. and Owens Corning
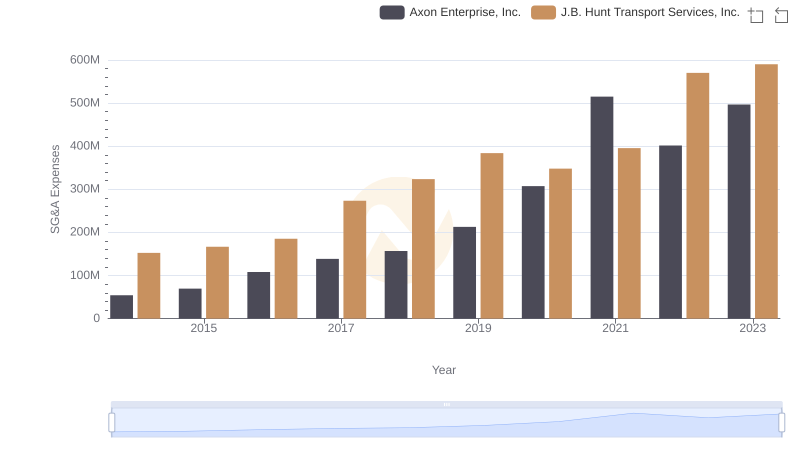
Who Optimizes SG&A Costs Better? Axon Enterprise, Inc. or J.B. Hunt Transport Services, Inc.