| __timestamp | Axon Enterprise, Inc. | RB Global, Inc. |
|---|---|---|
| Wednesday, January 1, 2014 | 62977000 | 57884000 |
| Thursday, January 1, 2015 | 69245000 | 56026000 |
| Friday, January 1, 2016 | 97709000 | 66062000 |
| Sunday, January 1, 2017 | 136710000 | 79013000 |
| Monday, January 1, 2018 | 161485000 | 533397000 |
| Tuesday, January 1, 2019 | 223574000 | 645816000 |
| Wednesday, January 1, 2020 | 264672000 | 615589000 |
| Friday, January 1, 2021 | 322471000 | 594783000 |
| Saturday, January 1, 2022 | 461297000 | 776701000 |
| Sunday, January 1, 2023 | 608009000 | 1901200000 |
| Monday, January 1, 2024 | 0 |
Infusing magic into the data realm
In the ever-evolving landscape of corporate finance, understanding cost structures is pivotal. This analysis delves into the cost of revenue trends for Axon Enterprise, Inc. and RB Global, Inc. from 2014 to 2023. Over this period, Axon Enterprise, Inc. witnessed a staggering 866% increase in its cost of revenue, reflecting its aggressive growth strategy and market expansion. In contrast, RB Global, Inc. experienced a more moderate yet significant 3,186% surge, peaking in 2023. This dramatic rise underscores the company's strategic investments and scaling operations.
These insights offer a window into the financial strategies shaping these industry leaders.
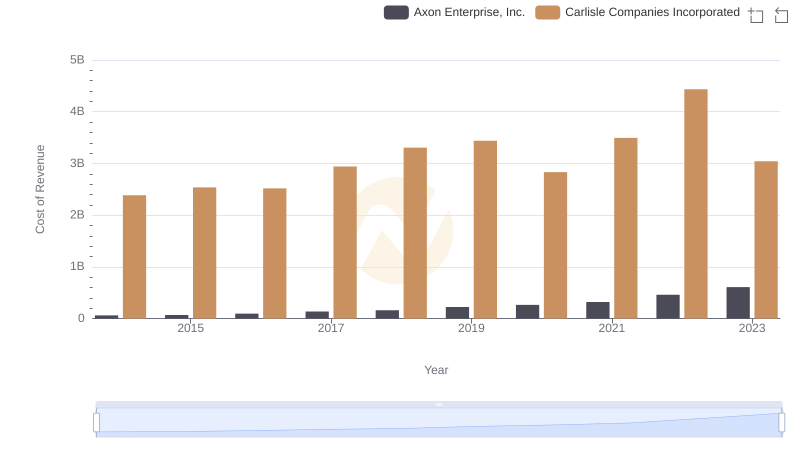
Cost Insights: Breaking Down Axon Enterprise, Inc. and Carlisle Companies Incorporated's Expenses
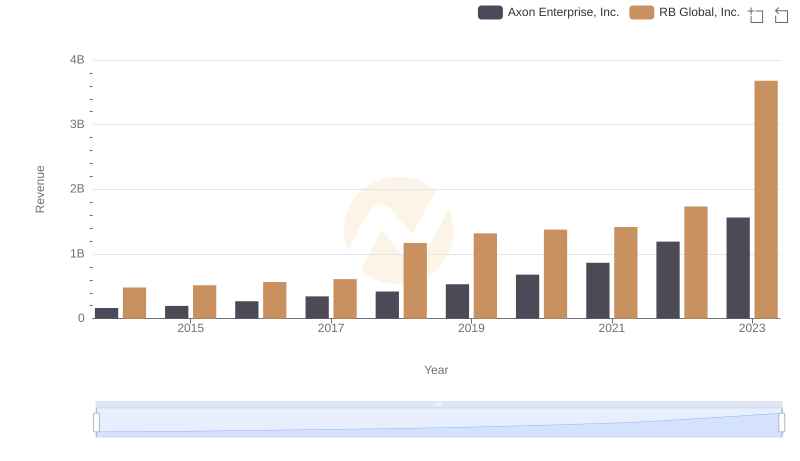
Revenue Insights: Axon Enterprise, Inc. and RB Global, Inc. Performance Compared
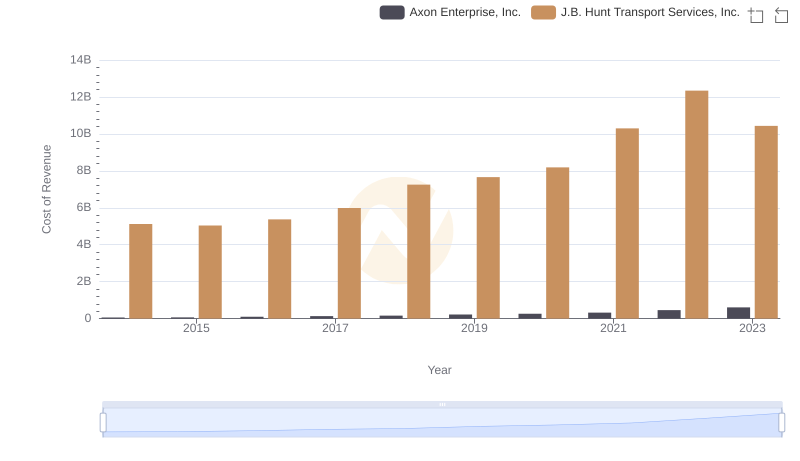
Cost of Revenue Trends: Axon Enterprise, Inc. vs J.B. Hunt Transport Services, Inc.
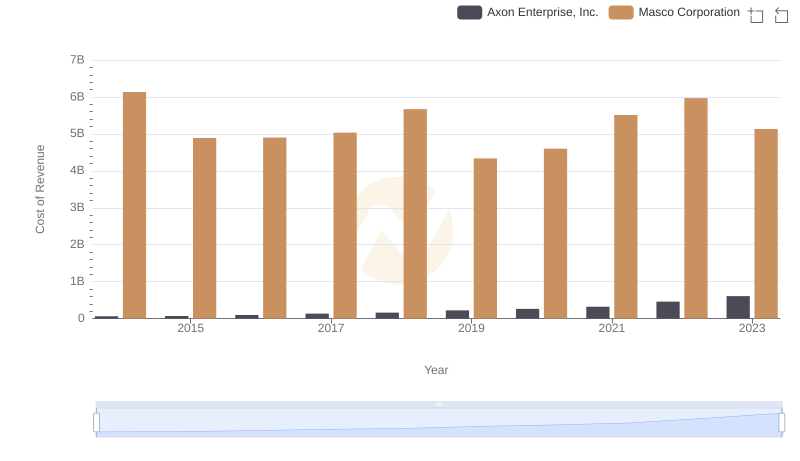
Cost of Revenue Comparison: Axon Enterprise, Inc. vs Masco Corporation
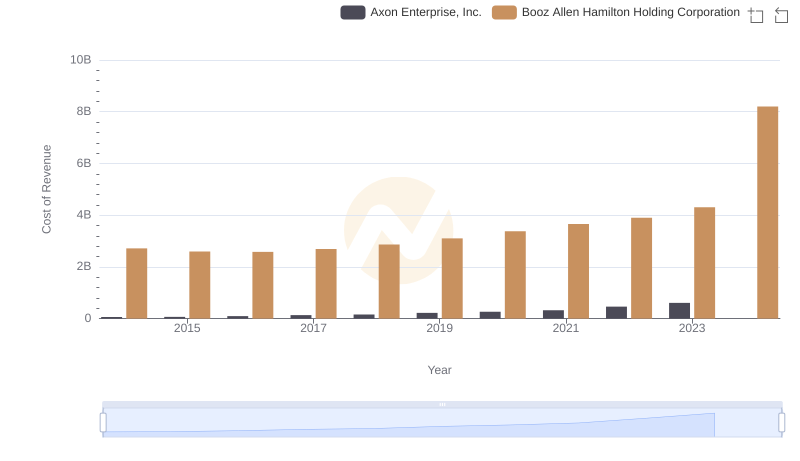
Cost of Revenue: Key Insights for Axon Enterprise, Inc. and Booz Allen Hamilton Holding Corporation
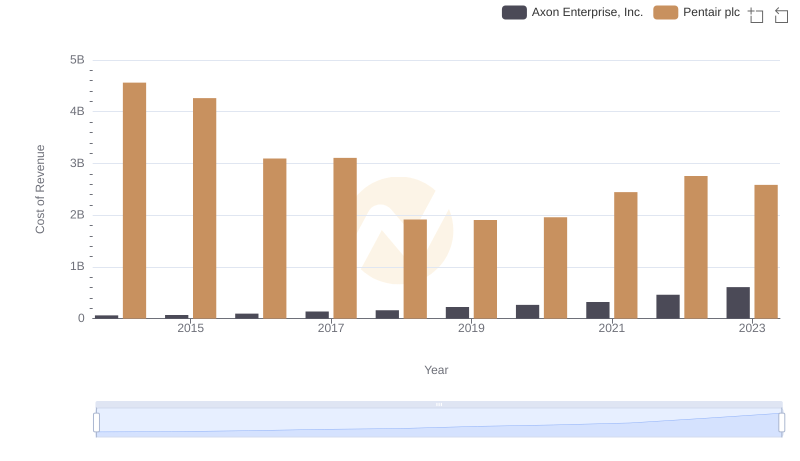
Axon Enterprise, Inc. vs Pentair plc: Efficiency in Cost of Revenue Explored
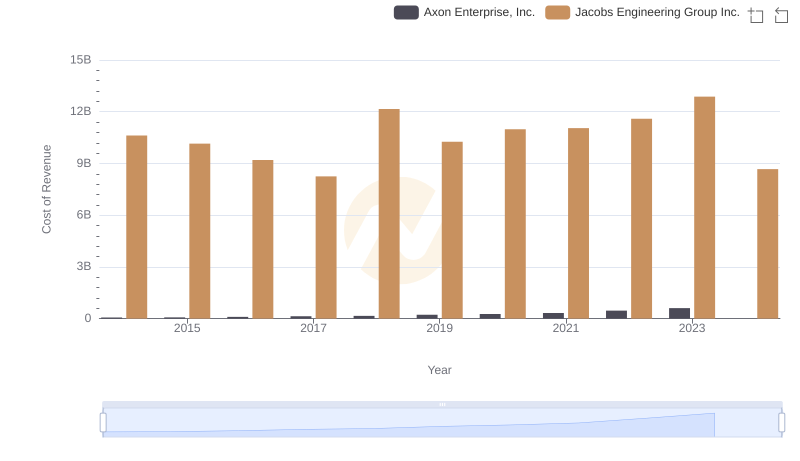
Analyzing Cost of Revenue: Axon Enterprise, Inc. and Jacobs Engineering Group Inc.
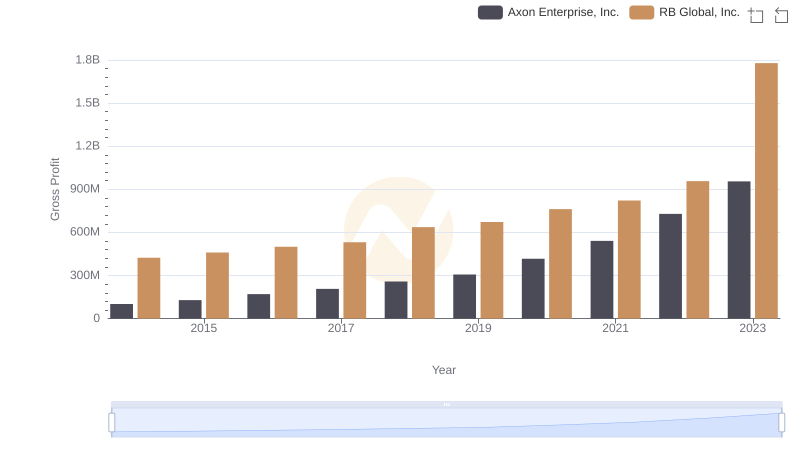
Gross Profit Trends Compared: Axon Enterprise, Inc. vs RB Global, Inc.
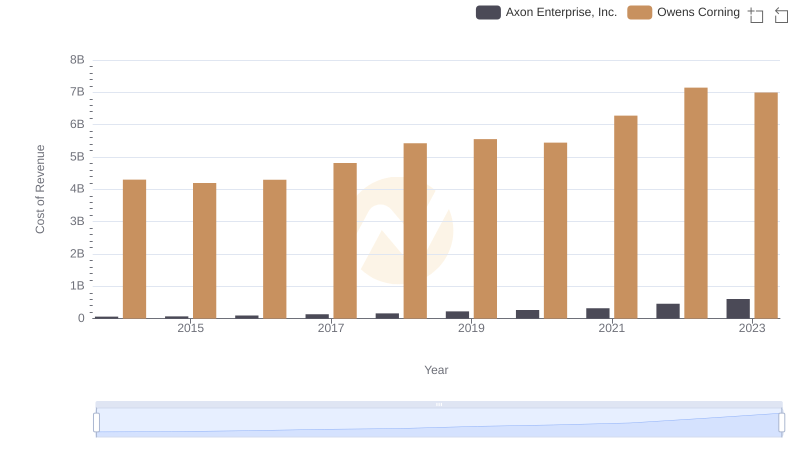
Cost of Revenue: Key Insights for Axon Enterprise, Inc. and Owens Corning
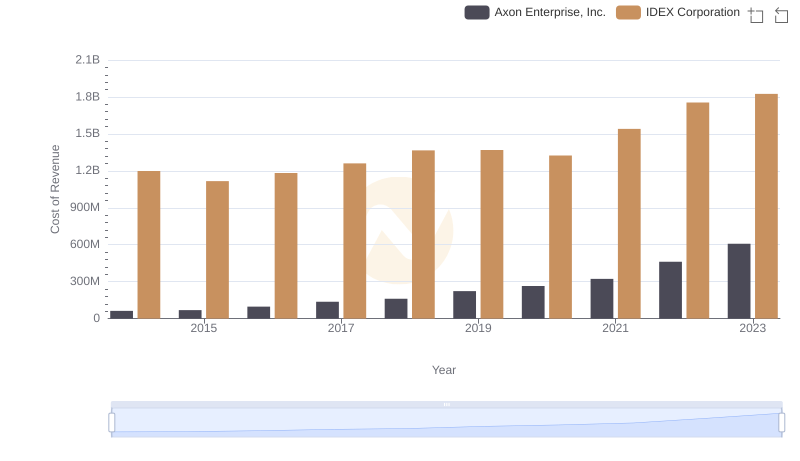
Comparing Cost of Revenue Efficiency: Axon Enterprise, Inc. vs IDEX Corporation
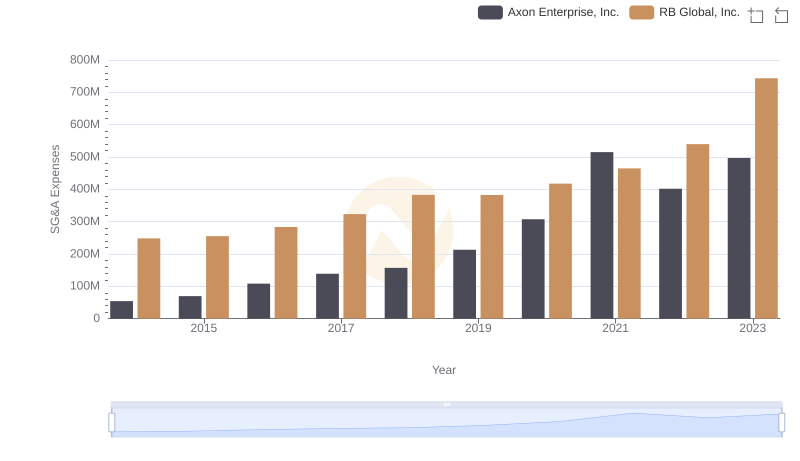
Axon Enterprise, Inc. vs RB Global, Inc.: SG&A Expense Trends