| __timestamp | Axon Enterprise, Inc. | Owens Corning |
|---|---|---|
| Wednesday, January 1, 2014 | 62977000 | 4300000000 |
| Thursday, January 1, 2015 | 69245000 | 4197000000 |
| Friday, January 1, 2016 | 97709000 | 4296000000 |
| Sunday, January 1, 2017 | 136710000 | 4812000000 |
| Monday, January 1, 2018 | 161485000 | 5425000000 |
| Tuesday, January 1, 2019 | 223574000 | 5551000000 |
| Wednesday, January 1, 2020 | 264672000 | 5445000000 |
| Friday, January 1, 2021 | 322471000 | 6281000000 |
| Saturday, January 1, 2022 | 461297000 | 7145000000 |
| Sunday, January 1, 2023 | 608009000 | 6994000000 |
Unleashing insights
In the evolving landscape of American industry, understanding the cost of revenue is crucial for assessing a company's financial health. Over the past decade, Axon Enterprise, Inc. and Owens Corning have shown distinct trajectories in their cost of revenue. From 2014 to 2023, Axon Enterprise, Inc. experienced a staggering increase of nearly 866% in its cost of revenue, reflecting its aggressive growth and expansion strategies. In contrast, Owens Corning, a stalwart in the building materials sector, saw a more modest increase of approximately 63% over the same period. This divergence highlights the dynamic nature of different industries and their operational strategies. As Axon continues to innovate in public safety technology, and Owens Corning solidifies its position in sustainable building solutions, these trends offer valuable insights into their financial strategies and market positioning.
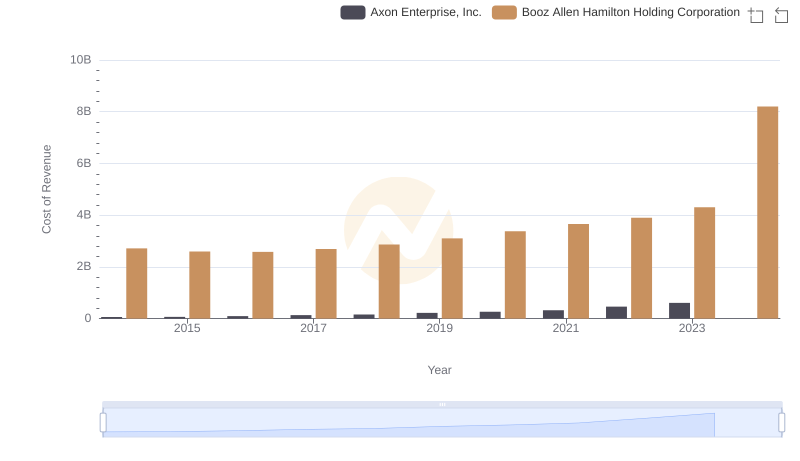
Cost of Revenue: Key Insights for Axon Enterprise, Inc. and Booz Allen Hamilton Holding Corporation
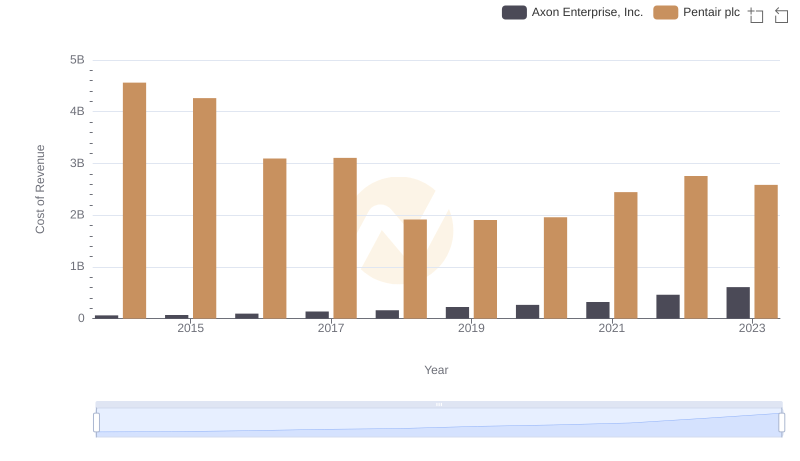
Axon Enterprise, Inc. vs Pentair plc: Efficiency in Cost of Revenue Explored
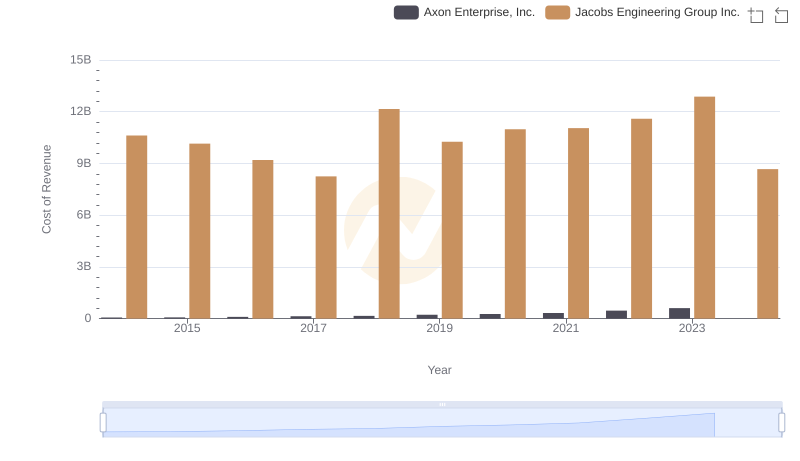
Analyzing Cost of Revenue: Axon Enterprise, Inc. and Jacobs Engineering Group Inc.
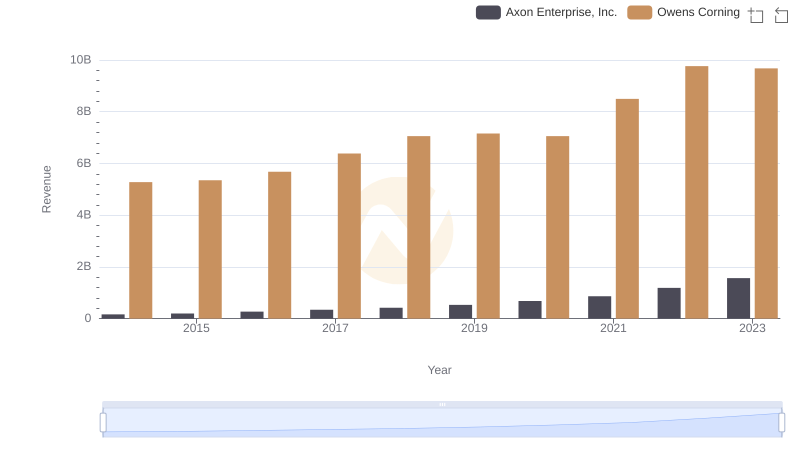
Who Generates More Revenue? Axon Enterprise, Inc. or Owens Corning
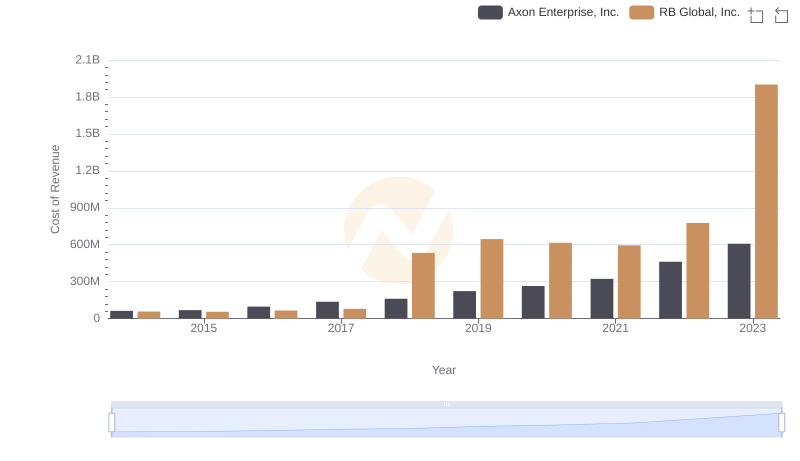
Cost Insights: Breaking Down Axon Enterprise, Inc. and RB Global, Inc.'s Expenses
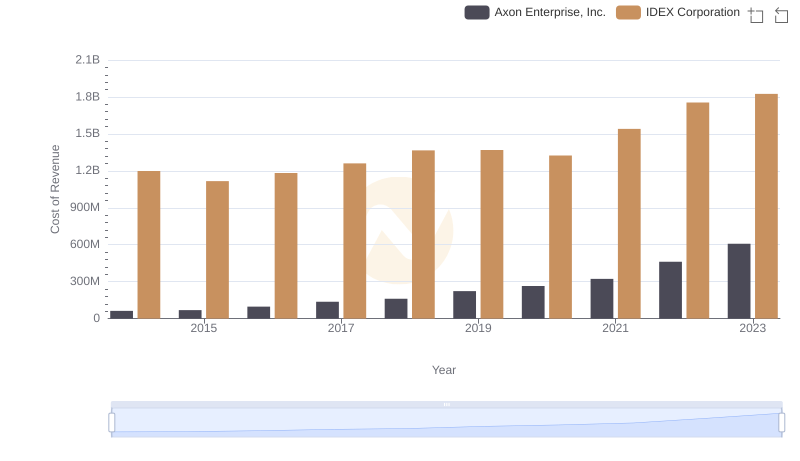
Comparing Cost of Revenue Efficiency: Axon Enterprise, Inc. vs IDEX Corporation
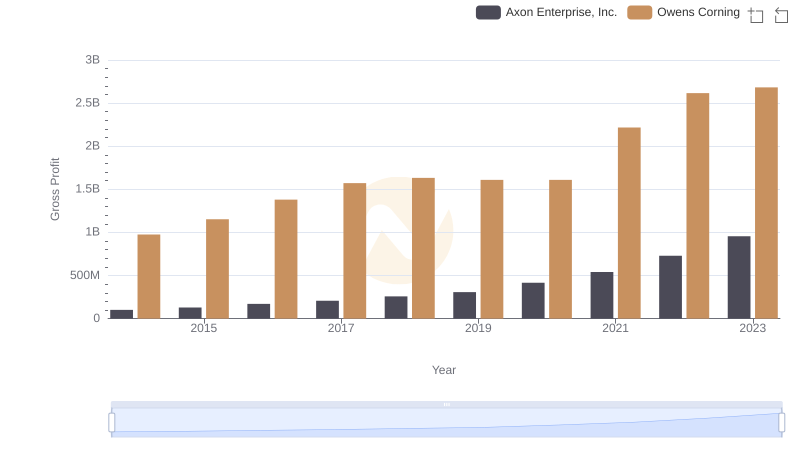
Gross Profit Analysis: Comparing Axon Enterprise, Inc. and Owens Corning
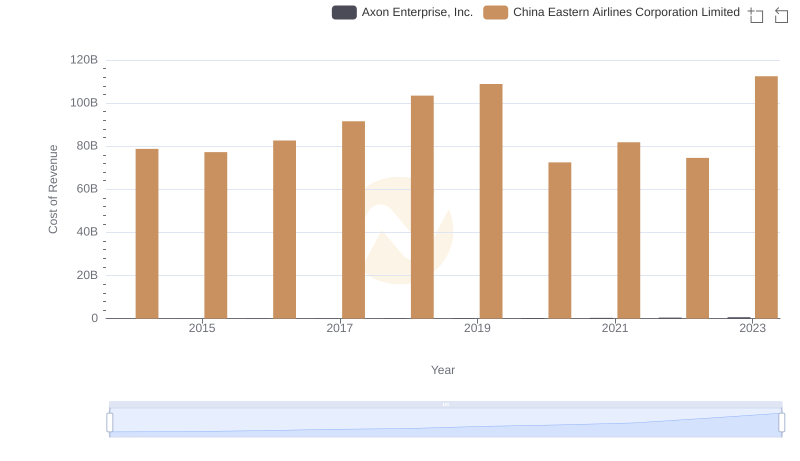
Cost Insights: Breaking Down Axon Enterprise, Inc. and China Eastern Airlines Corporation Limited's Expenses
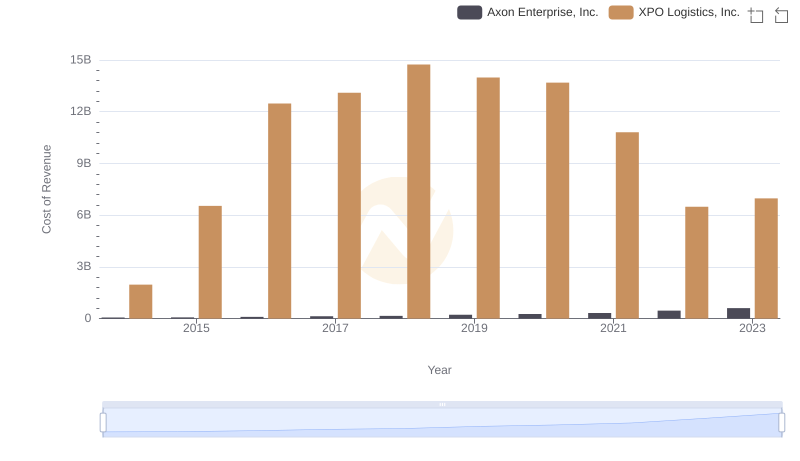
Comparing Cost of Revenue Efficiency: Axon Enterprise, Inc. vs XPO Logistics, Inc.
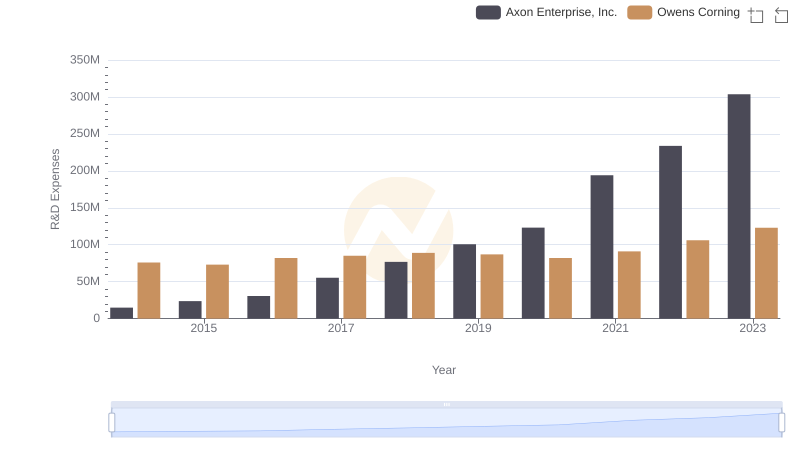
Research and Development Investment: Axon Enterprise, Inc. vs Owens Corning
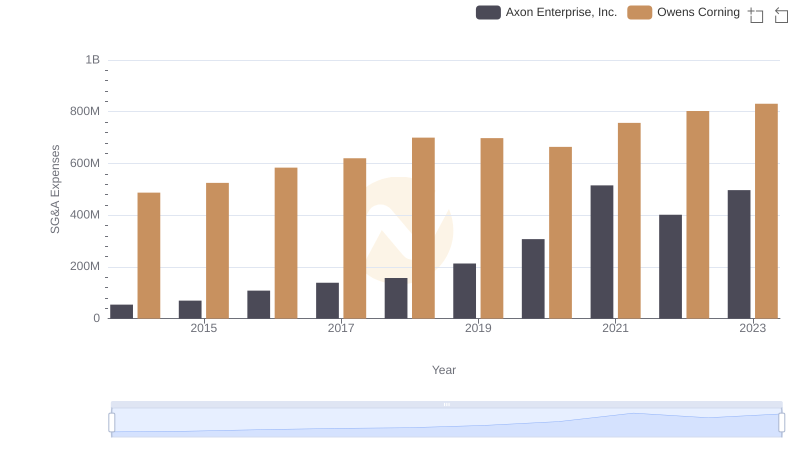
Comparing SG&A Expenses: Axon Enterprise, Inc. vs Owens Corning Trends and Insights