| __timestamp | Axon Enterprise, Inc. | Snap-on Incorporated |
|---|---|---|
| Wednesday, January 1, 2014 | 62977000 | 1693400000 |
| Thursday, January 1, 2015 | 69245000 | 1704500000 |
| Friday, January 1, 2016 | 97709000 | 1720800000 |
| Sunday, January 1, 2017 | 136710000 | 1862000000 |
| Monday, January 1, 2018 | 161485000 | 1870700000 |
| Tuesday, January 1, 2019 | 223574000 | 1886000000 |
| Wednesday, January 1, 2020 | 264672000 | 1844000000 |
| Friday, January 1, 2021 | 322471000 | 2141200000 |
| Saturday, January 1, 2022 | 461297000 | 2311700000 |
| Sunday, January 1, 2023 | 608009000 | 2488500000 |
| Monday, January 1, 2024 | 2329500000 |
Unleashing the power of data
In the ever-evolving landscape of American industry, understanding the cost of revenue is crucial for evaluating a company's financial health. This analysis delves into the cost of revenue trends for Axon Enterprise, Inc. and Snap-on Incorporated from 2014 to 2023.
Axon Enterprise, Inc., known for its innovative public safety technologies, has seen a remarkable increase in its cost of revenue, growing nearly tenfold over the past decade. Starting at approximately $63 million in 2014, it surged to over $608 million by 2023, reflecting the company's rapid expansion and increased production costs.
Conversely, Snap-on Incorporated, a leader in professional tools and equipment, has maintained a more stable trajectory. Its cost of revenue increased by about 47% over the same period, from $1.69 billion to $2.49 billion, indicating steady growth and efficient cost management.
This comparative analysis highlights the dynamic nature of cost structures in different industries, offering valuable insights for investors and industry analysts.
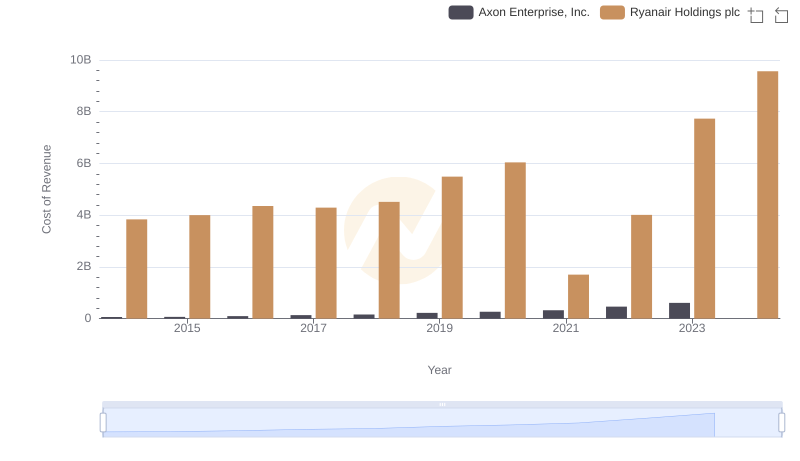
Comparing Cost of Revenue Efficiency: Axon Enterprise, Inc. vs Ryanair Holdings plc
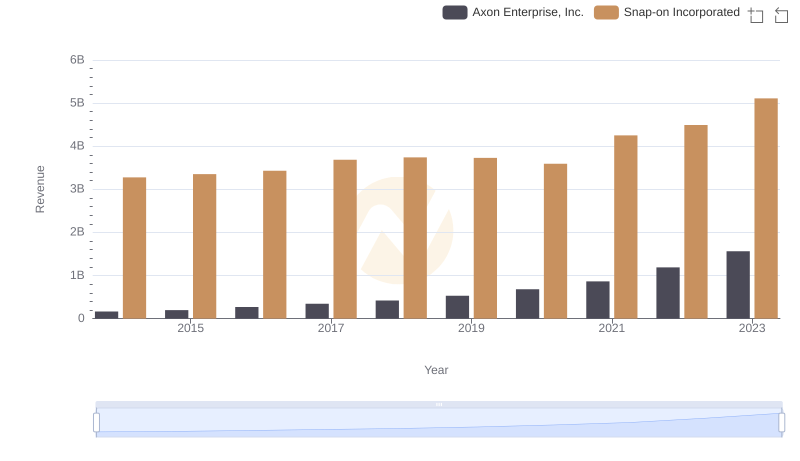
Axon Enterprise, Inc. vs Snap-on Incorporated: Examining Key Revenue Metrics
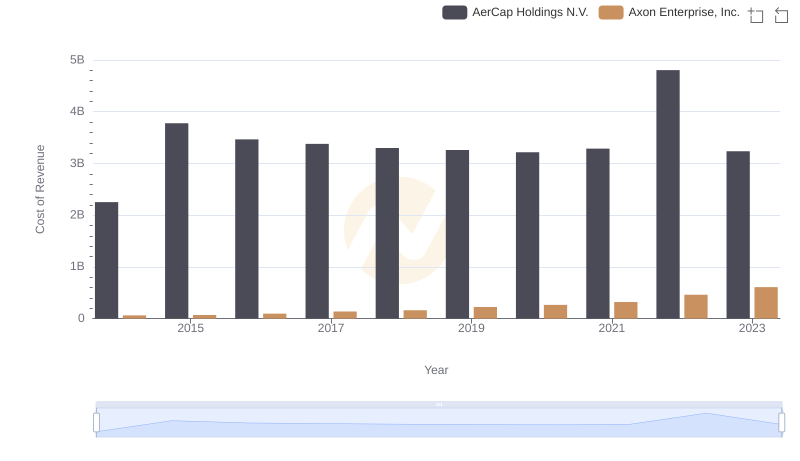
Cost of Revenue: Key Insights for Axon Enterprise, Inc. and AerCap Holdings N.V.
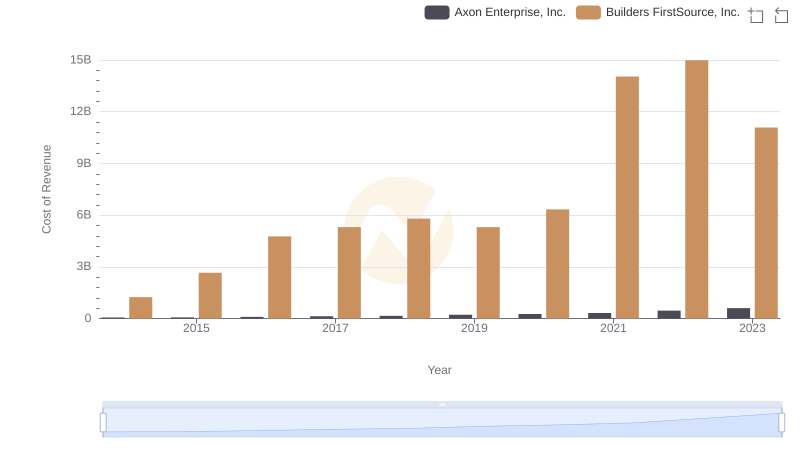
Axon Enterprise, Inc. vs Builders FirstSource, Inc.: Efficiency in Cost of Revenue Explored
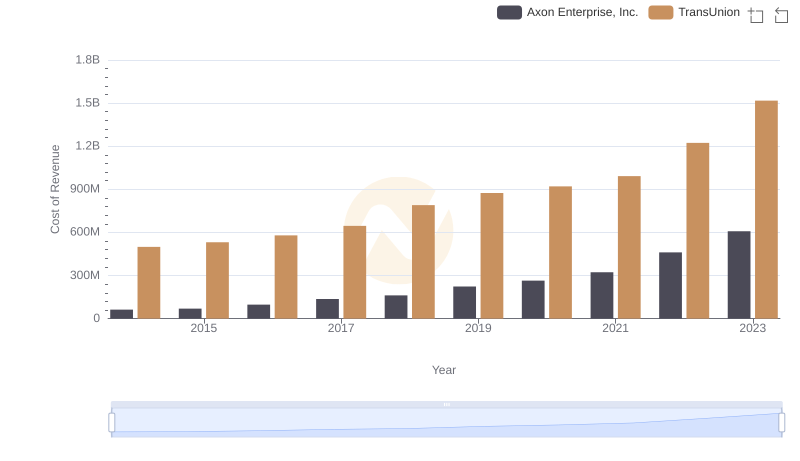
Cost Insights: Breaking Down Axon Enterprise, Inc. and TransUnion's Expenses
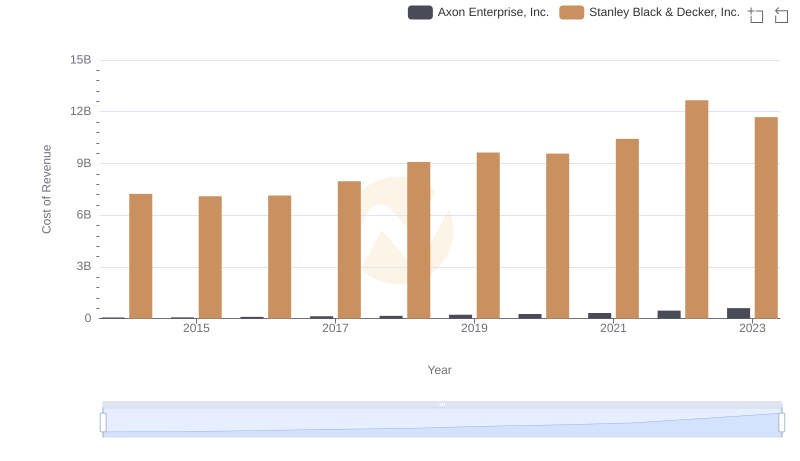
Cost of Revenue Trends: Axon Enterprise, Inc. vs Stanley Black & Decker, Inc.
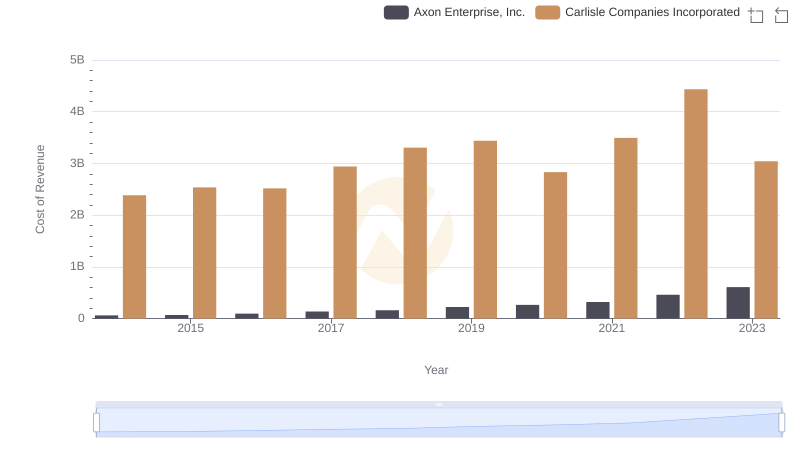
Cost Insights: Breaking Down Axon Enterprise, Inc. and Carlisle Companies Incorporated's Expenses
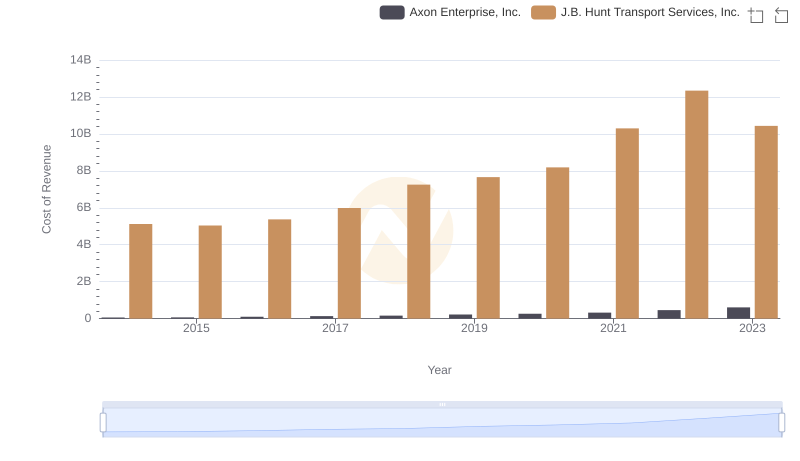
Cost of Revenue Trends: Axon Enterprise, Inc. vs J.B. Hunt Transport Services, Inc.
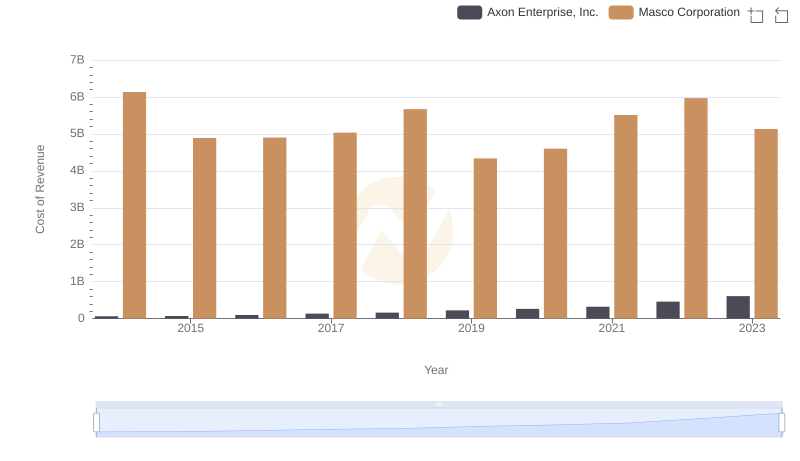
Cost of Revenue Comparison: Axon Enterprise, Inc. vs Masco Corporation
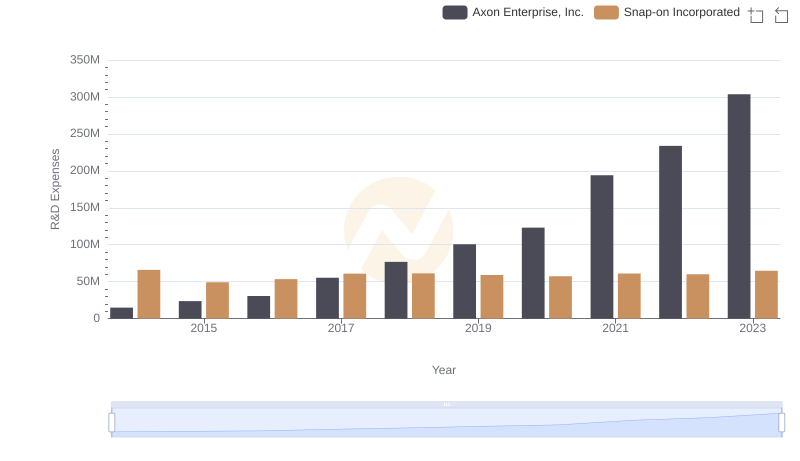
R&D Insights: How Axon Enterprise, Inc. and Snap-on Incorporated Allocate Funds
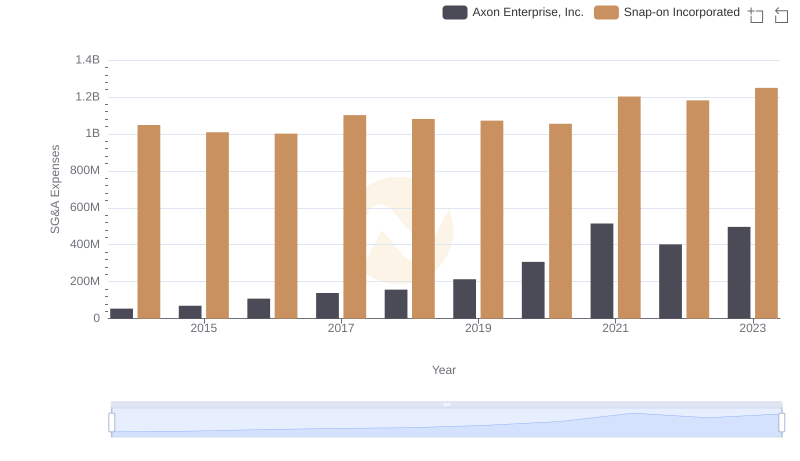
Axon Enterprise, Inc. or Snap-on Incorporated: Who Manages SG&A Costs Better?