| __timestamp | Axon Enterprise, Inc. | Booz Allen Hamilton Holding Corporation |
|---|---|---|
| Wednesday, January 1, 2014 | 62977000 | 2716113000 |
| Thursday, January 1, 2015 | 69245000 | 2593849000 |
| Friday, January 1, 2016 | 97709000 | 2580026000 |
| Sunday, January 1, 2017 | 136710000 | 2691982000 |
| Monday, January 1, 2018 | 161485000 | 2867103000 |
| Tuesday, January 1, 2019 | 223574000 | 3100466000 |
| Wednesday, January 1, 2020 | 264672000 | 3379180000 |
| Friday, January 1, 2021 | 322471000 | 3657530000 |
| Saturday, January 1, 2022 | 461297000 | 3899622000 |
| Sunday, January 1, 2023 | 608009000 | 4304810000 |
| Monday, January 1, 2024 | 8202847000 |
Unleashing insights
In the evolving landscape of corporate finance, understanding the cost of revenue is crucial for assessing a company's efficiency and profitability. Over the past decade, Axon Enterprise, Inc. and Booz Allen Hamilton Holding Corporation have shown distinct trajectories in their cost of revenue. From 2014 to 2023, Axon Enterprise experienced a staggering increase of nearly 866%, reflecting its aggressive growth strategy and expanding market presence. In contrast, Booz Allen Hamilton's cost of revenue grew by approximately 59%, indicating a more stable and consistent operational model.
These trends underscore the differing business strategies and market dynamics faced by these two industry leaders.

Cost of Revenue: Key Insights for Axon Enterprise, Inc. and Snap-on Incorporated
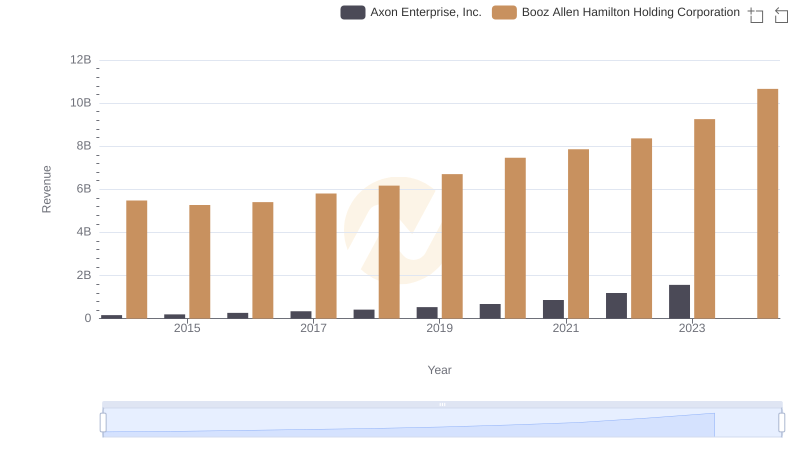
Annual Revenue Comparison: Axon Enterprise, Inc. vs Booz Allen Hamilton Holding Corporation
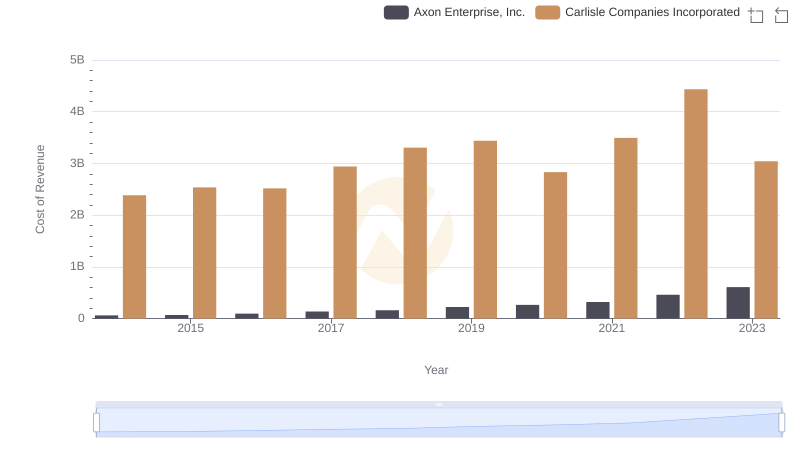
Cost Insights: Breaking Down Axon Enterprise, Inc. and Carlisle Companies Incorporated's Expenses
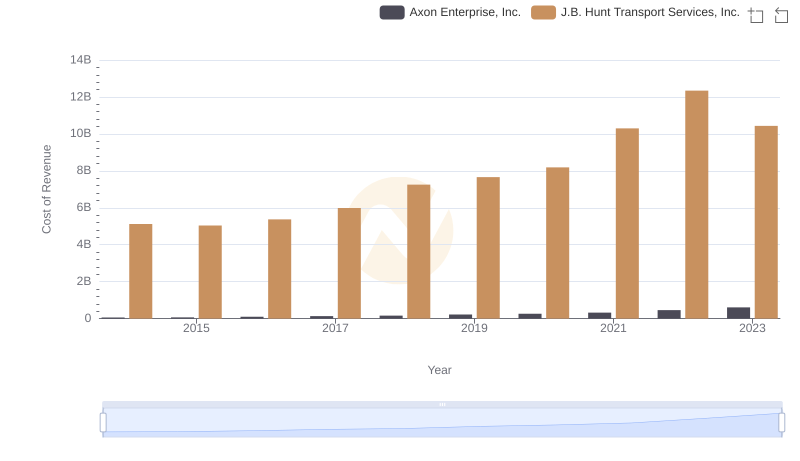
Cost of Revenue Trends: Axon Enterprise, Inc. vs J.B. Hunt Transport Services, Inc.
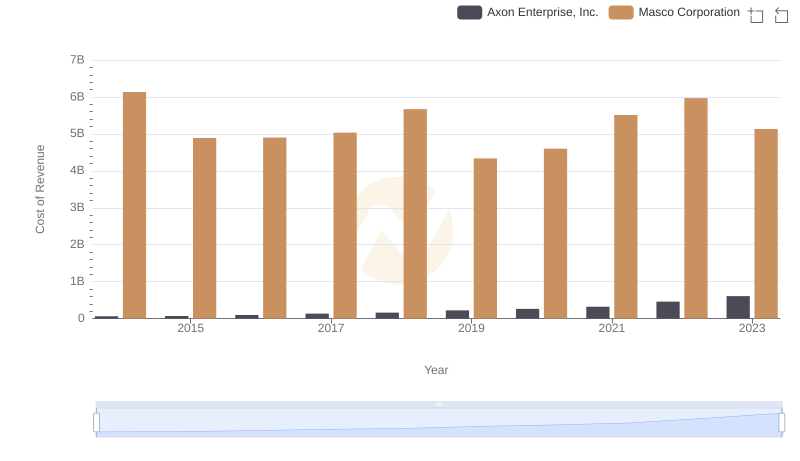
Cost of Revenue Comparison: Axon Enterprise, Inc. vs Masco Corporation
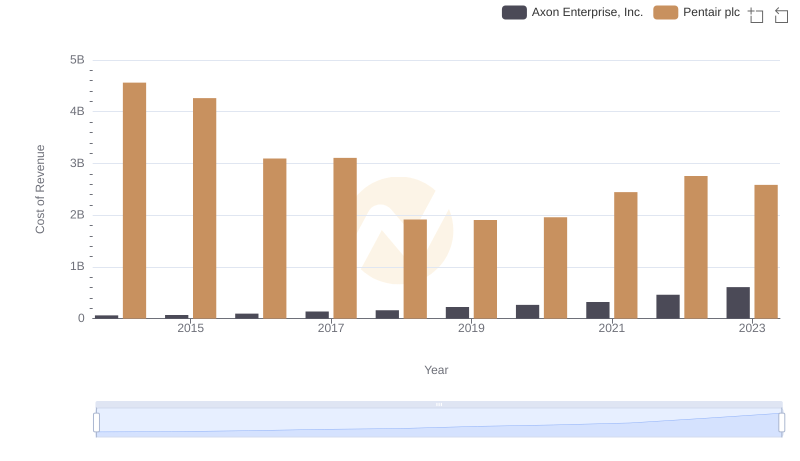
Axon Enterprise, Inc. vs Pentair plc: Efficiency in Cost of Revenue Explored
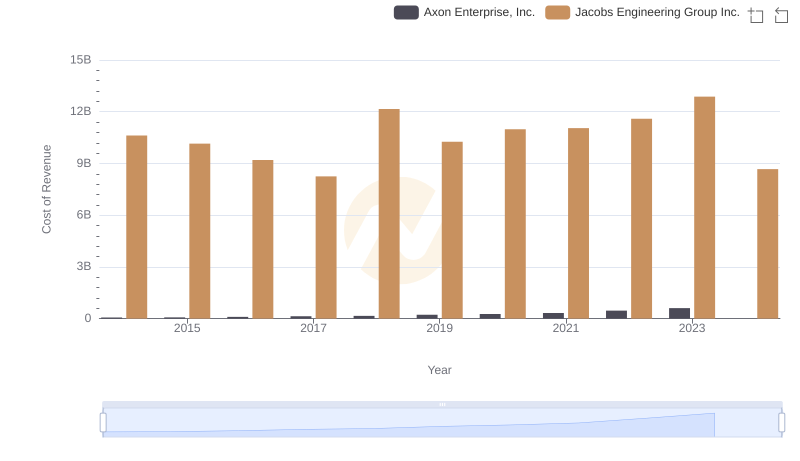
Analyzing Cost of Revenue: Axon Enterprise, Inc. and Jacobs Engineering Group Inc.
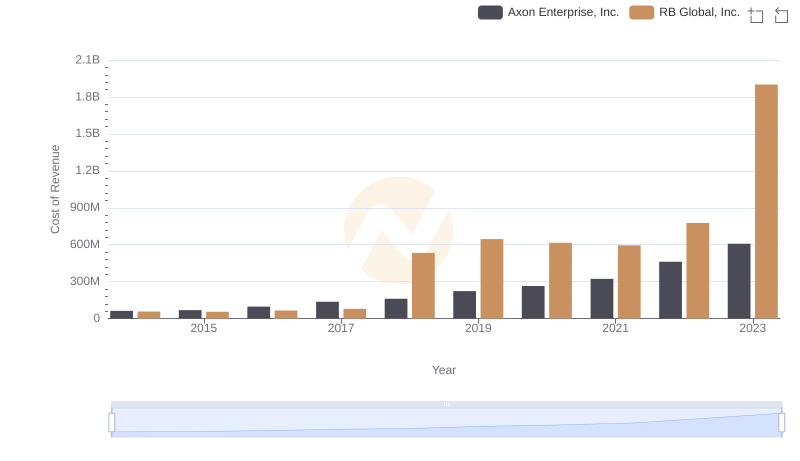
Cost Insights: Breaking Down Axon Enterprise, Inc. and RB Global, Inc.'s Expenses
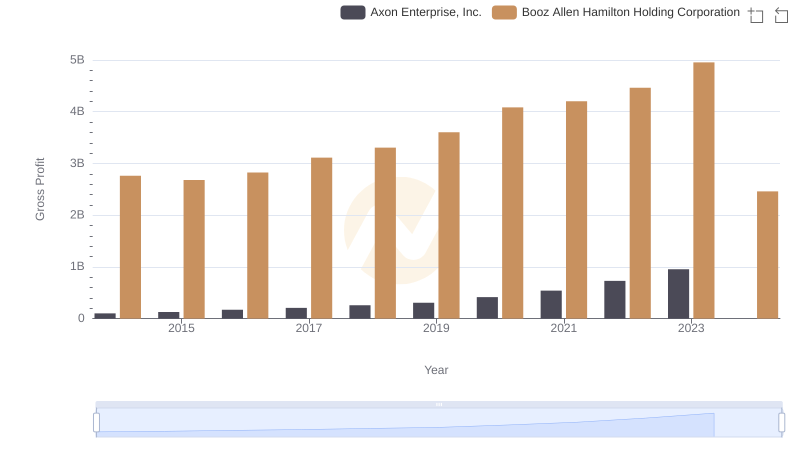
Axon Enterprise, Inc. and Booz Allen Hamilton Holding Corporation: A Detailed Gross Profit Analysis
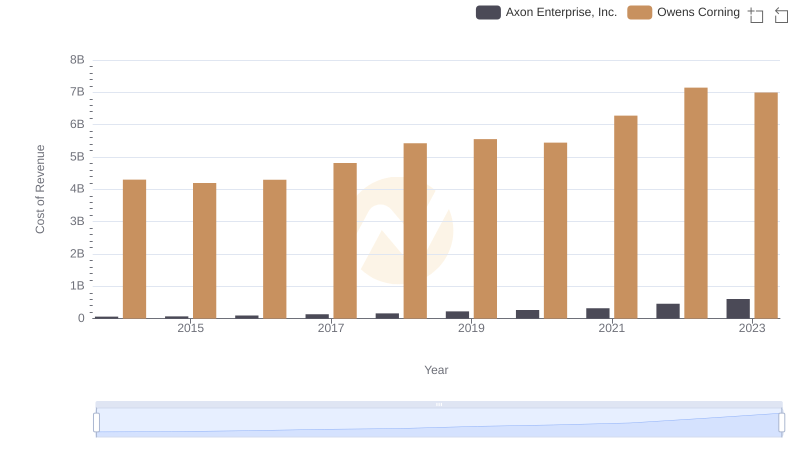
Cost of Revenue: Key Insights for Axon Enterprise, Inc. and Owens Corning
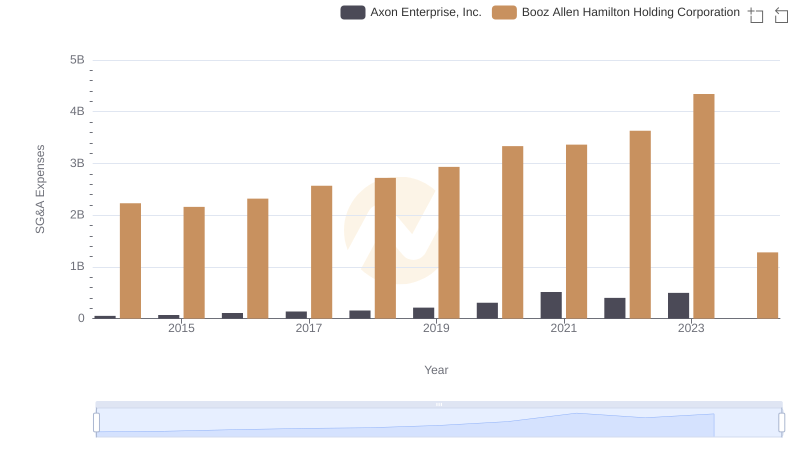
Axon Enterprise, Inc. vs Booz Allen Hamilton Holding Corporation: SG&A Expense Trends