| __timestamp | Axon Enterprise, Inc. | Stanley Black & Decker, Inc. |
|---|---|---|
| Wednesday, January 1, 2014 | 62977000 | 7235900000 |
| Thursday, January 1, 2015 | 69245000 | 7099800000 |
| Friday, January 1, 2016 | 97709000 | 7139700000 |
| Sunday, January 1, 2017 | 136710000 | 7969200000 |
| Monday, January 1, 2018 | 161485000 | 9080500000 |
| Tuesday, January 1, 2019 | 223574000 | 9636700000 |
| Wednesday, January 1, 2020 | 264672000 | 9566700000 |
| Friday, January 1, 2021 | 322471000 | 10423000000 |
| Saturday, January 1, 2022 | 461297000 | 12663300000 |
| Sunday, January 1, 2023 | 608009000 | 11683100000 |
| Monday, January 1, 2024 | 10851300000 |
Igniting the spark of knowledge
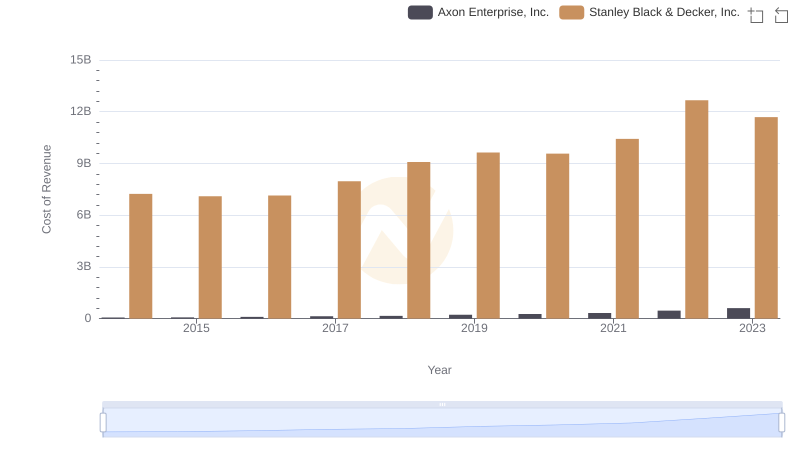
In the ever-evolving landscape of industrial innovation, Axon Enterprise, Inc. and Stanley Black & Decker, Inc. stand as titans of their respective domains. Over the past decade, from 2014 to 2023, these companies have showcased contrasting trajectories in their cost of revenue. Axon, a leader in public safety technology, has seen its cost of revenue surge by nearly 866%, reflecting its aggressive expansion and innovation strategies. Meanwhile, Stanley Black & Decker, a stalwart in tools and storage, has maintained a steady growth of approximately 61%, underscoring its resilience and market dominance. This comparison not only highlights the dynamic nature of these industries but also offers a glimpse into the strategic priorities that drive these companies forward. As we delve deeper into these trends, it becomes evident that understanding cost structures is crucial for investors and industry watchers alike.
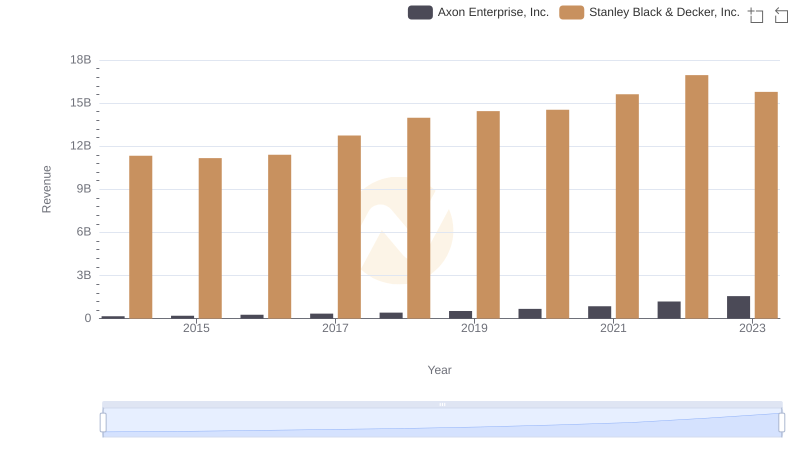
Revenue Showdown: Axon Enterprise, Inc. vs Stanley Black & Decker, Inc.
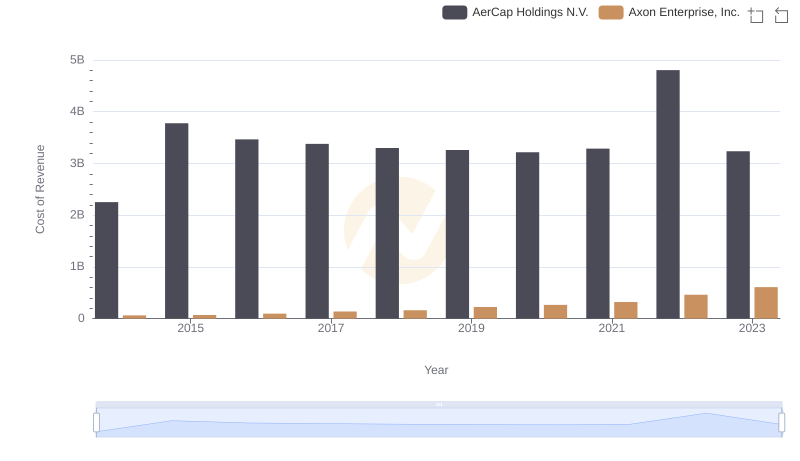
Cost of Revenue: Key Insights for Axon Enterprise, Inc. and AerCap Holdings N.V.
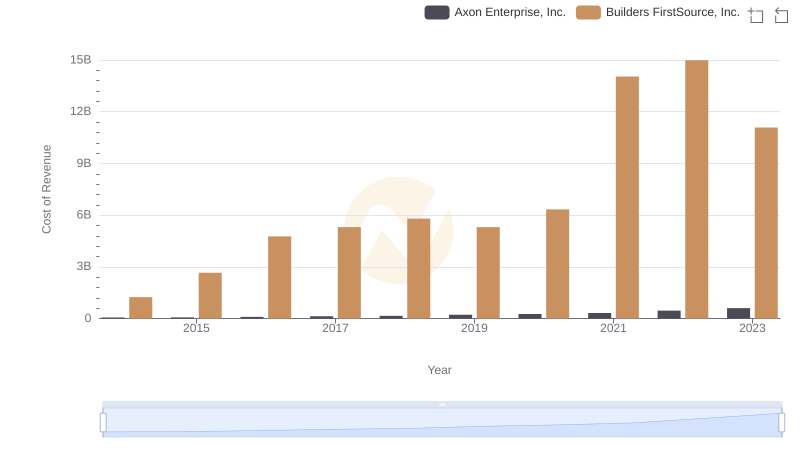
Axon Enterprise, Inc. vs Builders FirstSource, Inc.: Efficiency in Cost of Revenue Explored
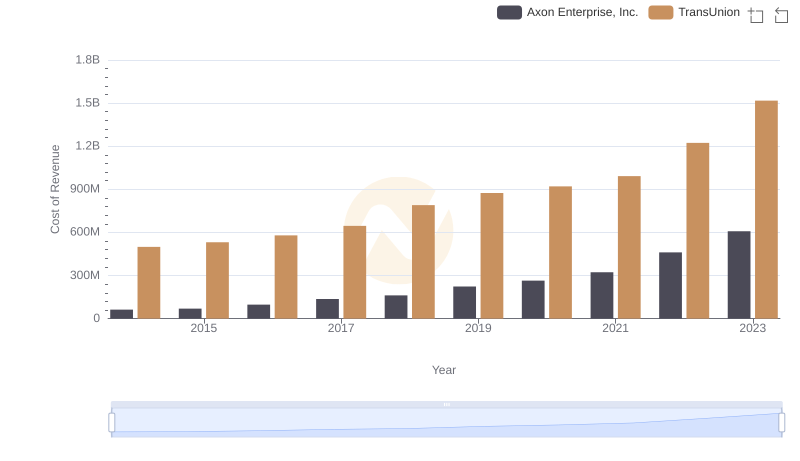
Cost Insights: Breaking Down Axon Enterprise, Inc. and TransUnion's Expenses
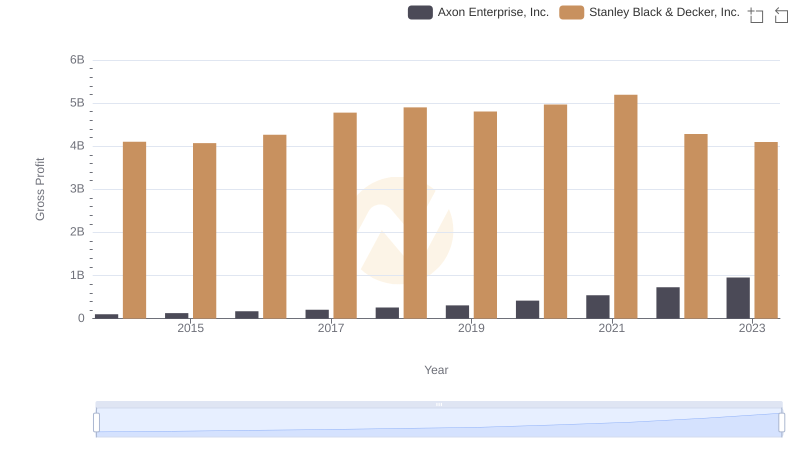
Axon Enterprise, Inc. and Stanley Black & Decker, Inc.: A Detailed Gross Profit Analysis
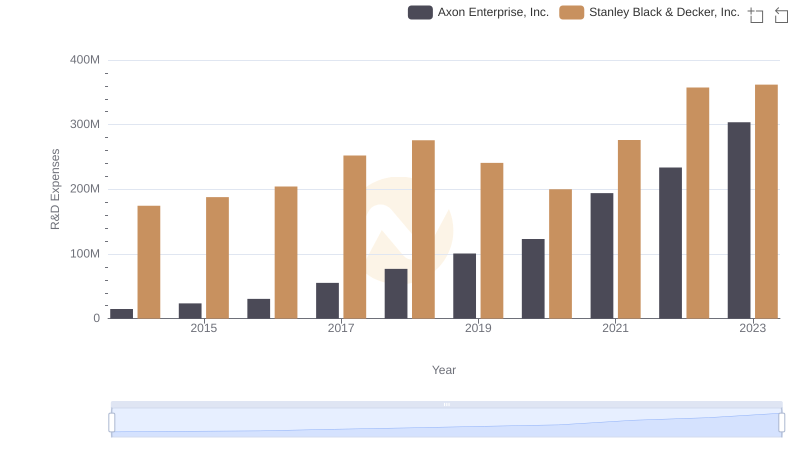
Who Prioritizes Innovation? R&D Spending Compared for Axon Enterprise, Inc. and Stanley Black & Decker, Inc.
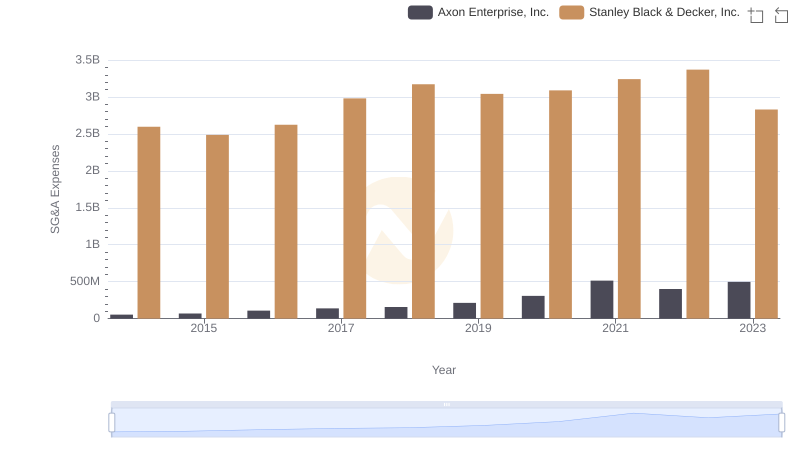
SG&A Efficiency Analysis: Comparing Axon Enterprise, Inc. and Stanley Black & Decker, Inc.
Cost Insights: Breaking Down Axon Enterprise, Inc. and Stanley Black & Decker, Inc.'s Expenses

Who Generates Higher Gross Profit? Axon Enterprise, Inc. or Stanley Black & Decker, Inc.

Research and Development Expenses Breakdown: Axon Enterprise, Inc. vs Stanley Black & Decker, Inc.

Axon Enterprise, Inc. vs Stanley Black & Decker, Inc.: SG&A Expense Trends