| __timestamp | Axon Enterprise, Inc. | Masco Corporation |
|---|---|---|
| Wednesday, January 1, 2014 | 62977000 | 6134000000 |
| Thursday, January 1, 2015 | 69245000 | 4889000000 |
| Friday, January 1, 2016 | 97709000 | 4901000000 |
| Sunday, January 1, 2017 | 136710000 | 5033000000 |
| Monday, January 1, 2018 | 161485000 | 5670000000 |
| Tuesday, January 1, 2019 | 223574000 | 4336000000 |
| Wednesday, January 1, 2020 | 264672000 | 4601000000 |
| Friday, January 1, 2021 | 322471000 | 5512000000 |
| Saturday, January 1, 2022 | 461297000 | 5967000000 |
| Sunday, January 1, 2023 | 608009000 | 5131000000 |
| Monday, January 1, 2024 | 4997000000 |
Unveiling the hidden dimensions of data
In the ever-evolving landscape of American business, Axon Enterprise, Inc. and Masco Corporation stand as intriguing case studies in cost management. Over the past decade, Axon has seen its cost of revenue skyrocket by nearly 866%, from approximately $63 million in 2014 to over $608 million in 2023. This growth reflects Axon's aggressive expansion and investment in cutting-edge technology.
Conversely, Masco Corporation, a stalwart in the home improvement sector, has maintained a relatively stable cost of revenue, fluctuating around the $5 billion mark. Despite a slight dip in 2019, Masco's cost of revenue has remained consistent, showcasing its operational efficiency and market resilience.
This comparison highlights the contrasting strategies of a tech-driven company versus a traditional manufacturing giant, offering valuable insights into their financial trajectories and market positioning.

Cost of Revenue: Key Insights for Axon Enterprise, Inc. and Snap-on Incorporated
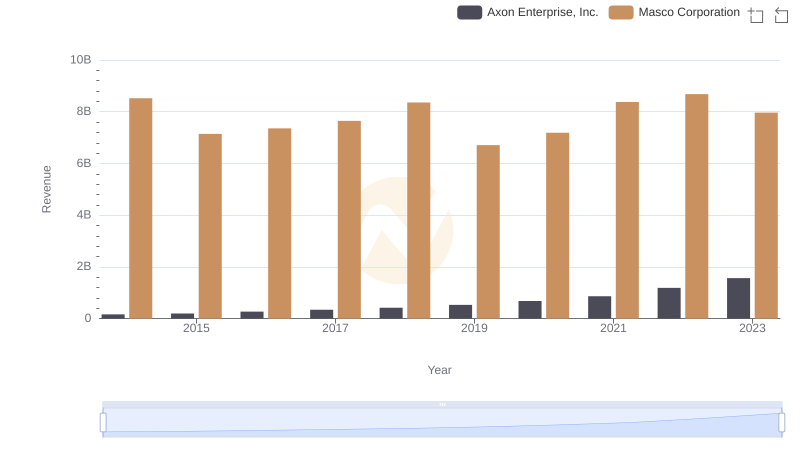
Axon Enterprise, Inc. and Masco Corporation: A Comprehensive Revenue Analysis
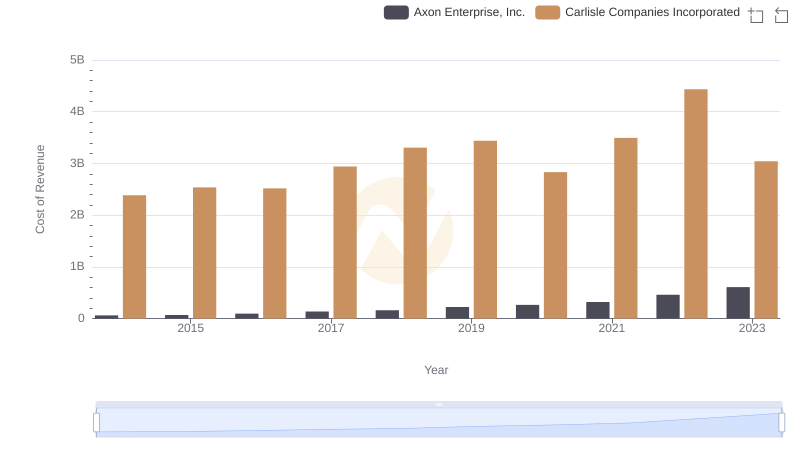
Cost Insights: Breaking Down Axon Enterprise, Inc. and Carlisle Companies Incorporated's Expenses
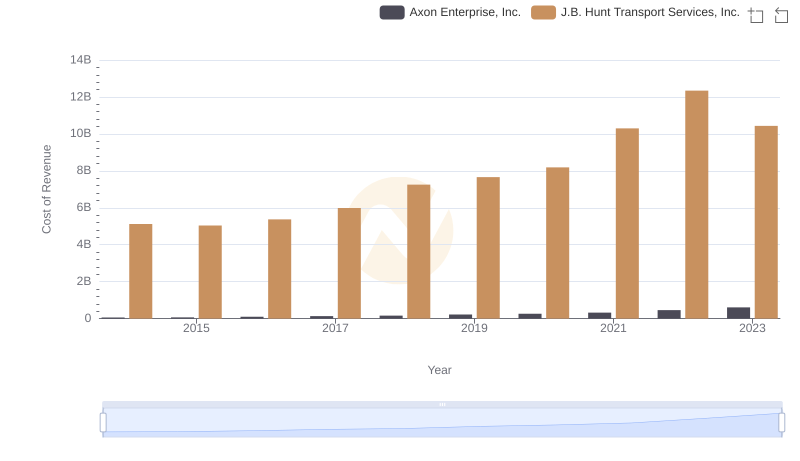
Cost of Revenue Trends: Axon Enterprise, Inc. vs J.B. Hunt Transport Services, Inc.
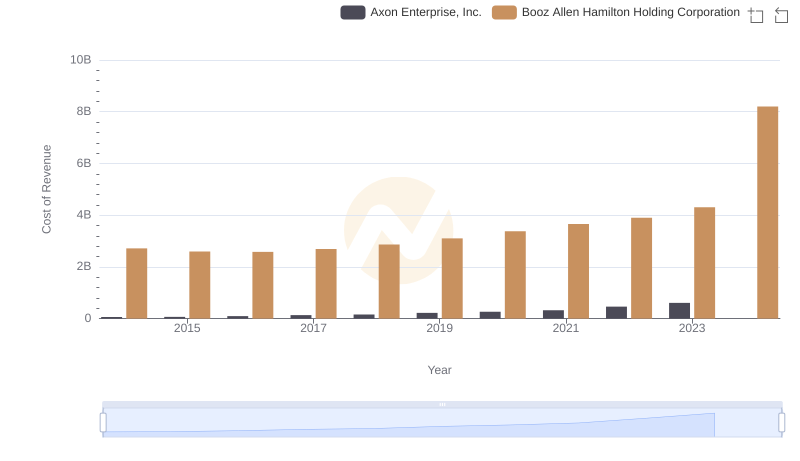
Cost of Revenue: Key Insights for Axon Enterprise, Inc. and Booz Allen Hamilton Holding Corporation
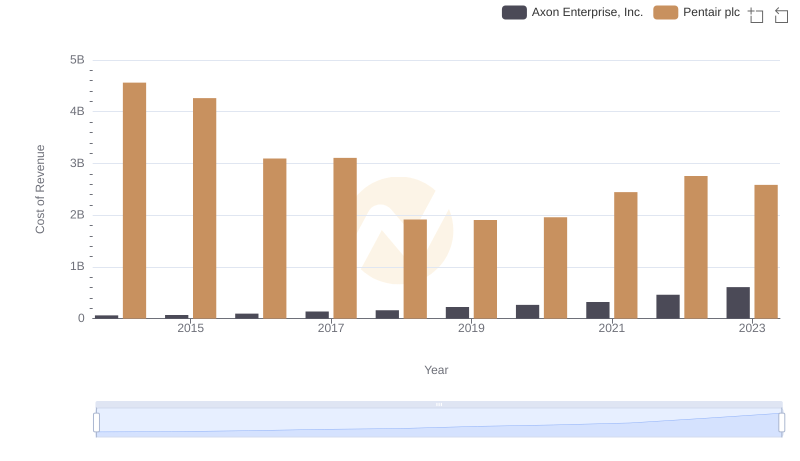
Axon Enterprise, Inc. vs Pentair plc: Efficiency in Cost of Revenue Explored
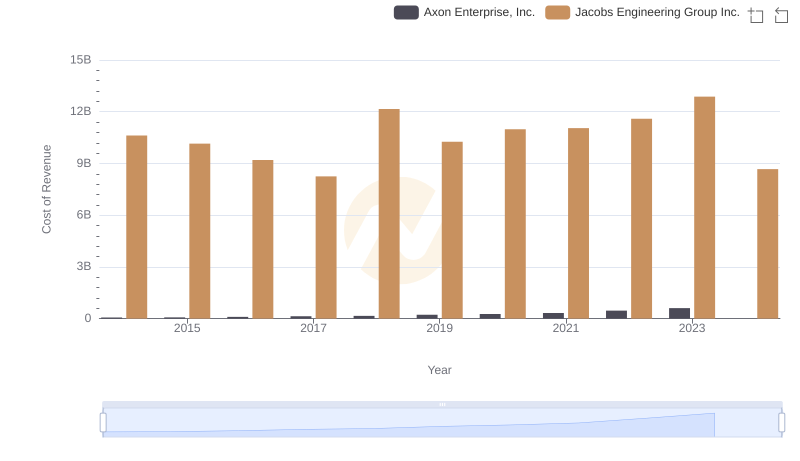
Analyzing Cost of Revenue: Axon Enterprise, Inc. and Jacobs Engineering Group Inc.
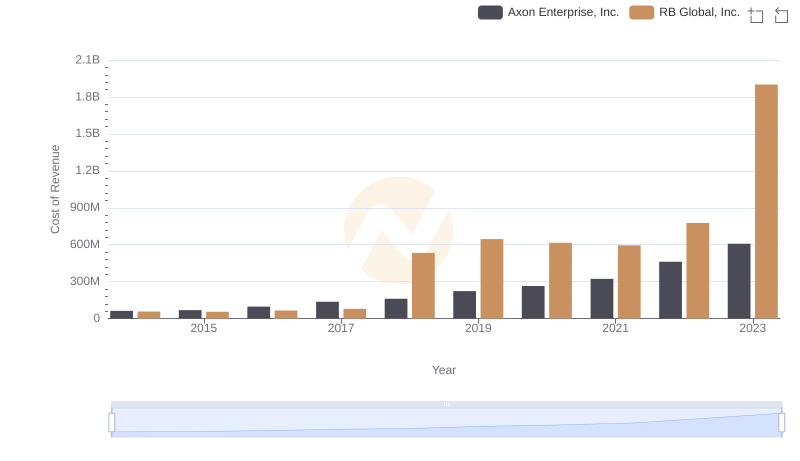
Cost Insights: Breaking Down Axon Enterprise, Inc. and RB Global, Inc.'s Expenses
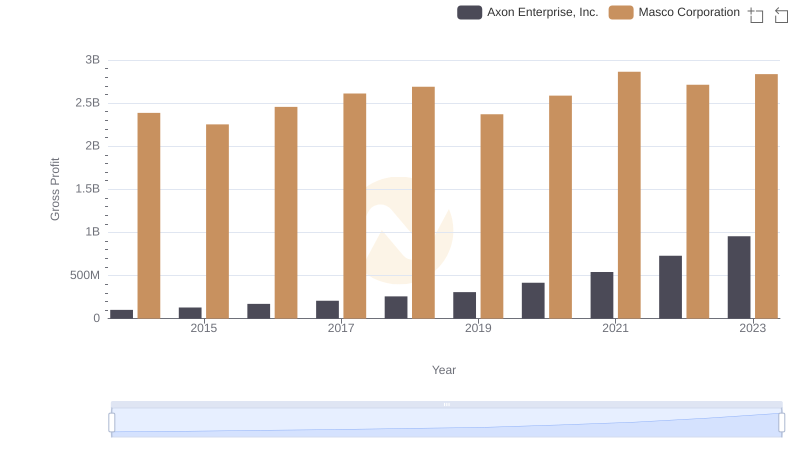
Axon Enterprise, Inc. and Masco Corporation: A Detailed Gross Profit Analysis
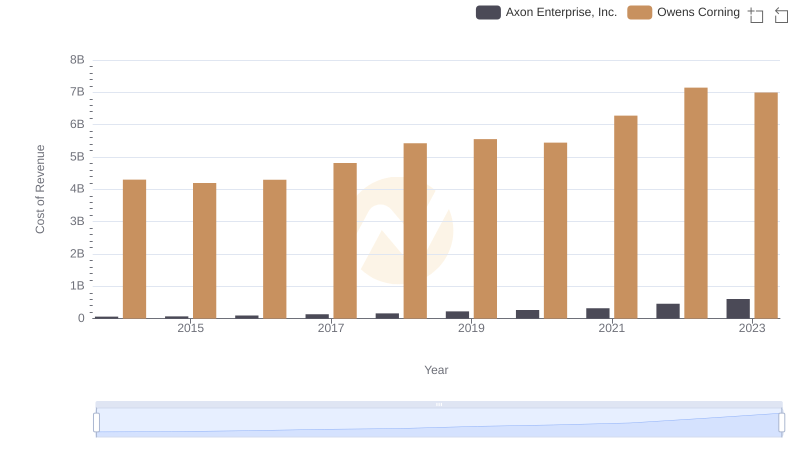
Cost of Revenue: Key Insights for Axon Enterprise, Inc. and Owens Corning
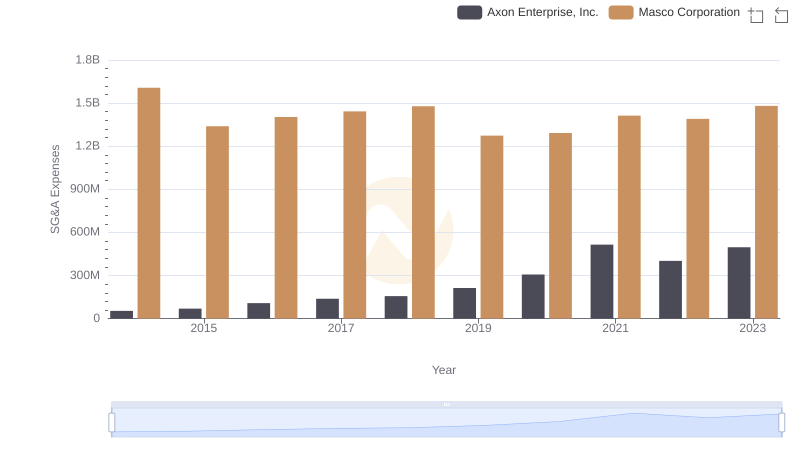
Operational Costs Compared: SG&A Analysis of Axon Enterprise, Inc. and Masco Corporation