| __timestamp | Axon Enterprise, Inc. | Jacobs Engineering Group Inc. |
|---|---|---|
| Wednesday, January 1, 2014 | 62977000 | 10621373000 |
| Thursday, January 1, 2015 | 69245000 | 10146494000 |
| Friday, January 1, 2016 | 97709000 | 9196326000 |
| Sunday, January 1, 2017 | 136710000 | 8250536000 |
| Monday, January 1, 2018 | 161485000 | 12156276000 |
| Tuesday, January 1, 2019 | 223574000 | 10260840000 |
| Wednesday, January 1, 2020 | 264672000 | 10980307000 |
| Friday, January 1, 2021 | 322471000 | 11048860000 |
| Saturday, January 1, 2022 | 461297000 | 11595785000 |
| Sunday, January 1, 2023 | 608009000 | 12879099000 |
| Monday, January 1, 2024 | 8668185000 |
Unleashing insights
In the ever-evolving landscape of American industry, understanding the cost of revenue is crucial for evaluating a company's financial health. Axon Enterprise, Inc. and Jacobs Engineering Group Inc. offer a fascinating case study in contrasting business models and financial strategies. From 2014 to 2023, Axon Enterprise, Inc. saw a staggering 866% increase in its cost of revenue, reflecting its aggressive growth and expansion strategies. In contrast, Jacobs Engineering Group Inc. maintained a more stable trajectory, with its cost of revenue fluctuating modestly around the $10 billion mark, peaking at $12.88 billion in 2023. This stability underscores Jacobs' focus on consistent, long-term growth. Notably, 2024 data for Axon is missing, highlighting the importance of complete data for accurate analysis. As these companies continue to evolve, their financial strategies will undoubtedly offer valuable insights into the broader market trends.
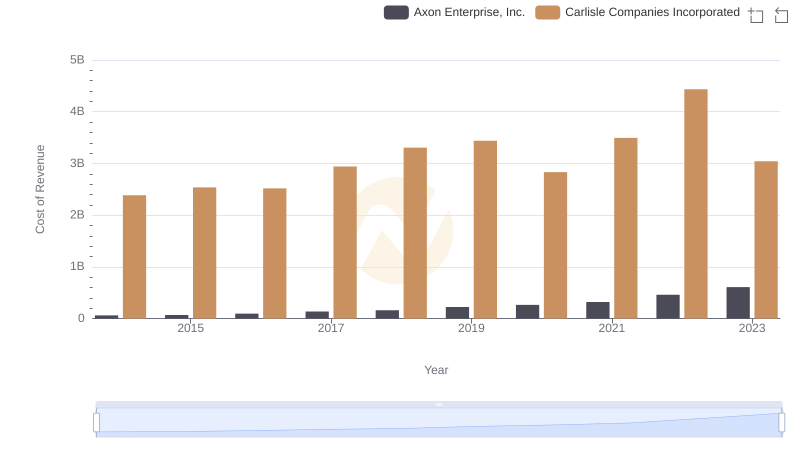
Cost Insights: Breaking Down Axon Enterprise, Inc. and Carlisle Companies Incorporated's Expenses
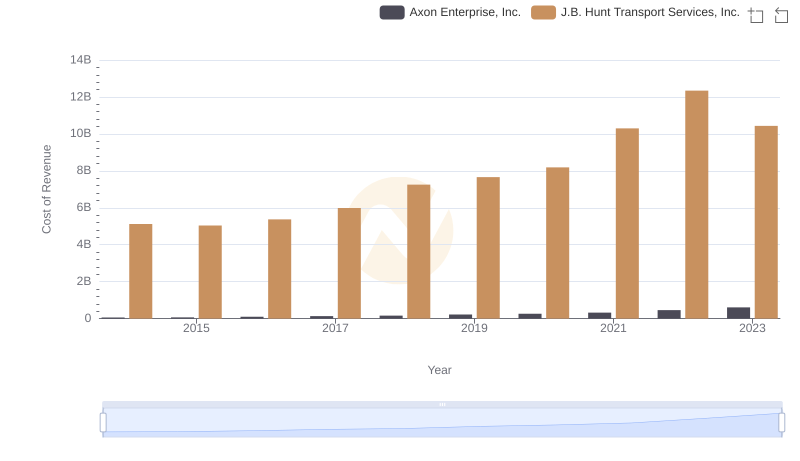
Cost of Revenue Trends: Axon Enterprise, Inc. vs J.B. Hunt Transport Services, Inc.
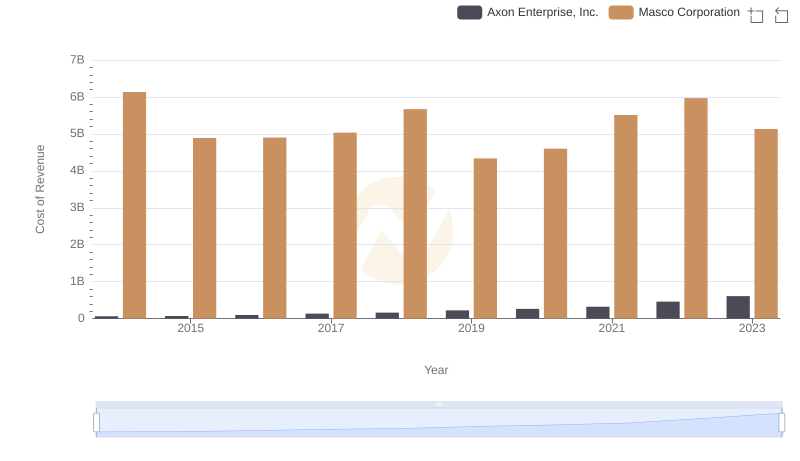
Cost of Revenue Comparison: Axon Enterprise, Inc. vs Masco Corporation
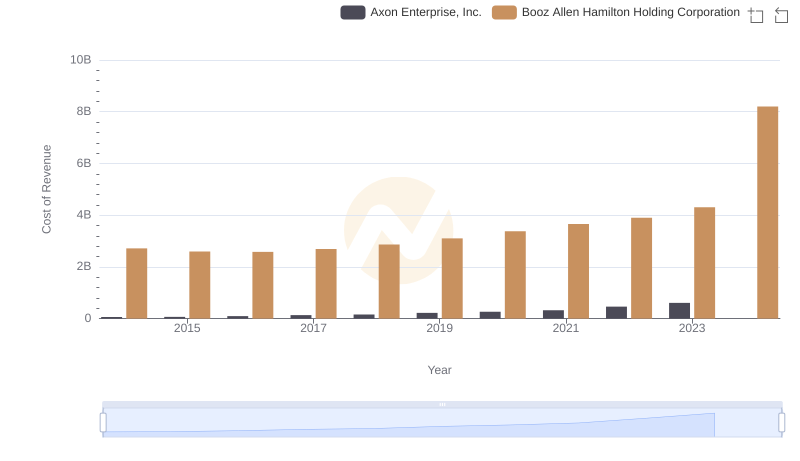
Cost of Revenue: Key Insights for Axon Enterprise, Inc. and Booz Allen Hamilton Holding Corporation
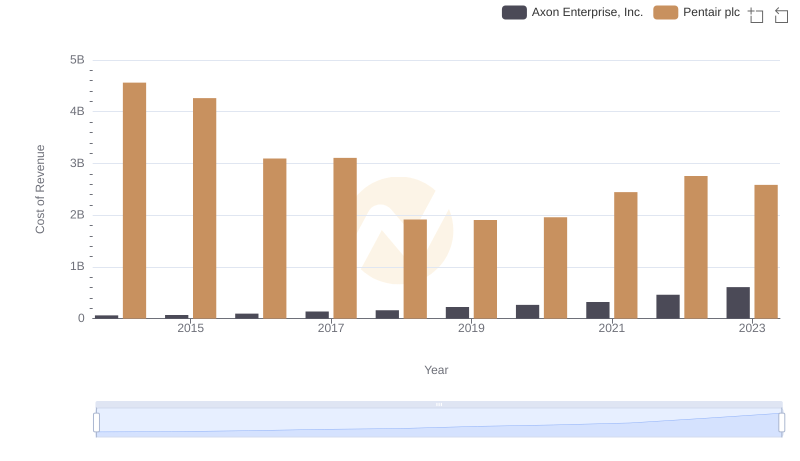
Axon Enterprise, Inc. vs Pentair plc: Efficiency in Cost of Revenue Explored
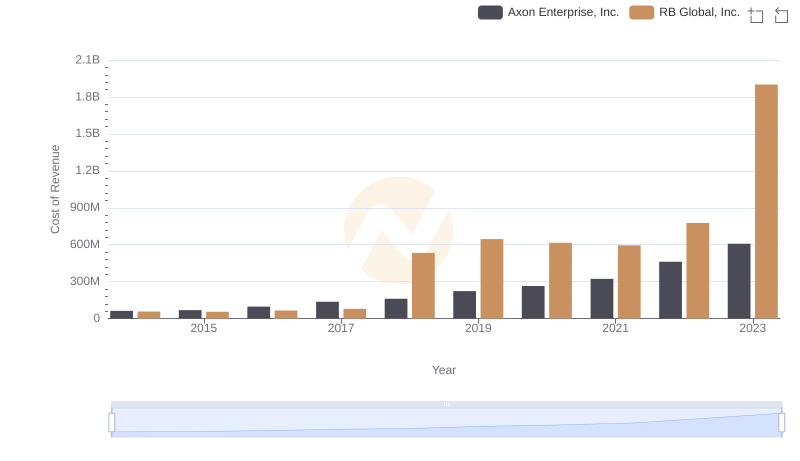
Cost Insights: Breaking Down Axon Enterprise, Inc. and RB Global, Inc.'s Expenses
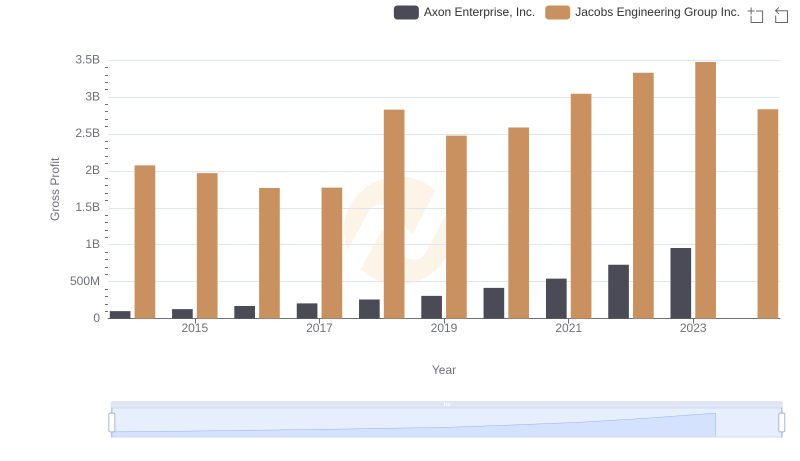
Axon Enterprise, Inc. vs Jacobs Engineering Group Inc.: A Gross Profit Performance Breakdown
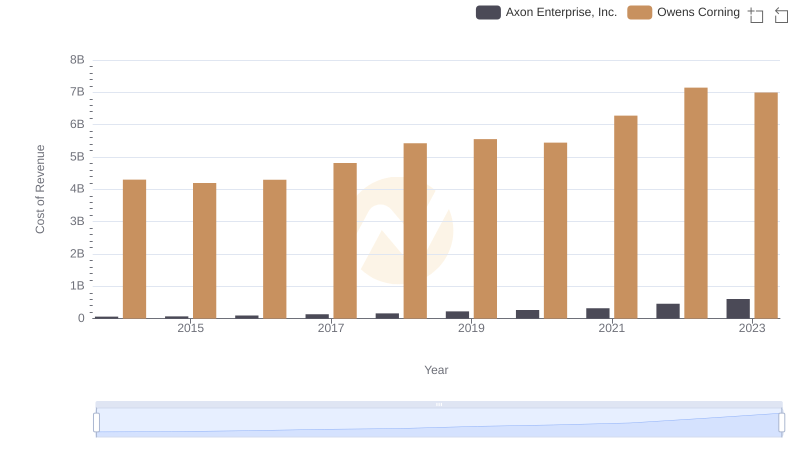
Cost of Revenue: Key Insights for Axon Enterprise, Inc. and Owens Corning
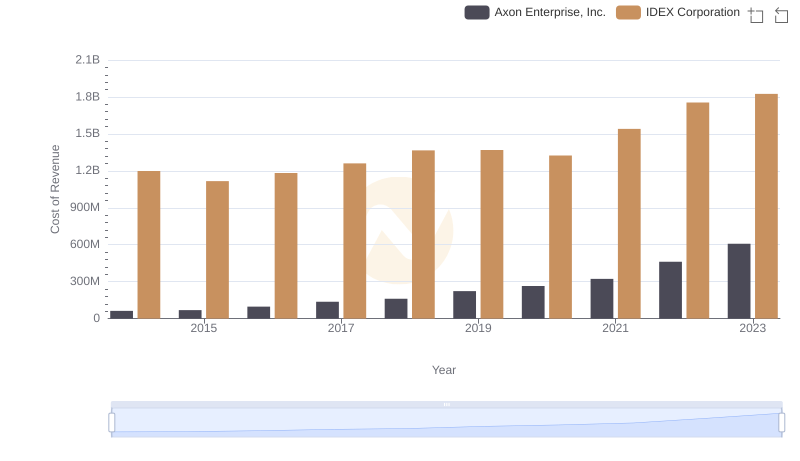
Comparing Cost of Revenue Efficiency: Axon Enterprise, Inc. vs IDEX Corporation
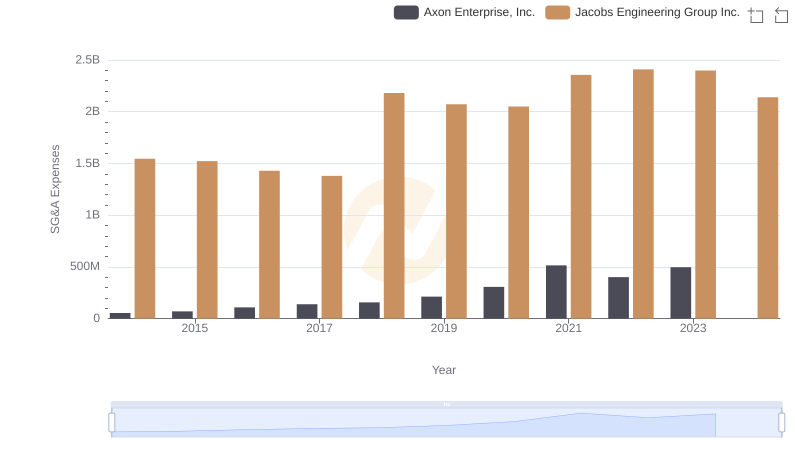
Axon Enterprise, Inc. and Jacobs Engineering Group Inc.: SG&A Spending Patterns Compared