| __timestamp | Axon Enterprise, Inc. | Carlisle Companies Incorporated |
|---|---|---|
| Wednesday, January 1, 2014 | 62977000 | 2384500000 |
| Thursday, January 1, 2015 | 69245000 | 2536500000 |
| Friday, January 1, 2016 | 97709000 | 2518100000 |
| Sunday, January 1, 2017 | 136710000 | 2941900000 |
| Monday, January 1, 2018 | 161485000 | 3304800000 |
| Tuesday, January 1, 2019 | 223574000 | 3439900000 |
| Wednesday, January 1, 2020 | 264672000 | 2832500000 |
| Friday, January 1, 2021 | 322471000 | 3495600000 |
| Saturday, January 1, 2022 | 461297000 | 4434500000 |
| Sunday, January 1, 2023 | 608009000 | 3042900000 |
| Monday, January 1, 2024 | 3115900000 |
Unleashing the power of data
In the ever-evolving landscape of corporate finance, understanding cost structures is crucial. Axon Enterprise, Inc. and Carlisle Companies Incorporated, two giants in their respective fields, offer a fascinating study in contrasts. From 2014 to 2023, Axon saw its cost of revenue grow by nearly 866%, reflecting its aggressive expansion and innovation in public safety technology. Meanwhile, Carlisle's cost of revenue fluctuated, peaking in 2022 with a 86% increase from 2014, before a notable 31% drop in 2023. This decline could signal strategic shifts or market adjustments. Such insights are invaluable for investors and analysts seeking to understand the financial health and strategic direction of these companies. As we delve deeper into these trends, the data reveals not just numbers, but stories of growth, adaptation, and resilience in the face of changing market dynamics.
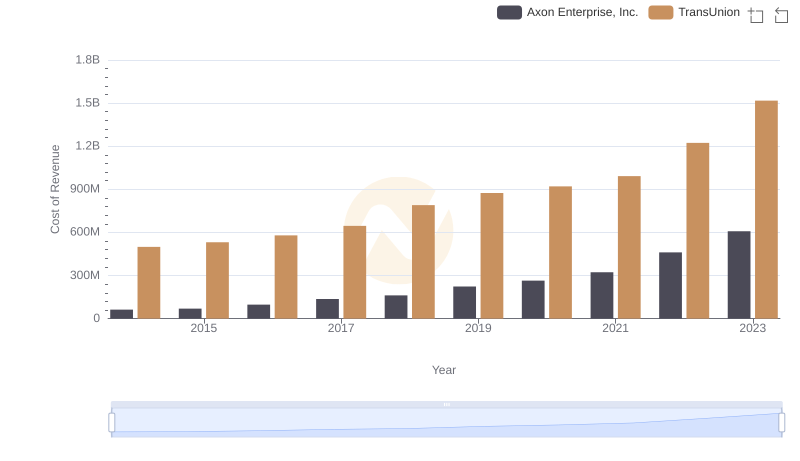
Cost Insights: Breaking Down Axon Enterprise, Inc. and TransUnion's Expenses
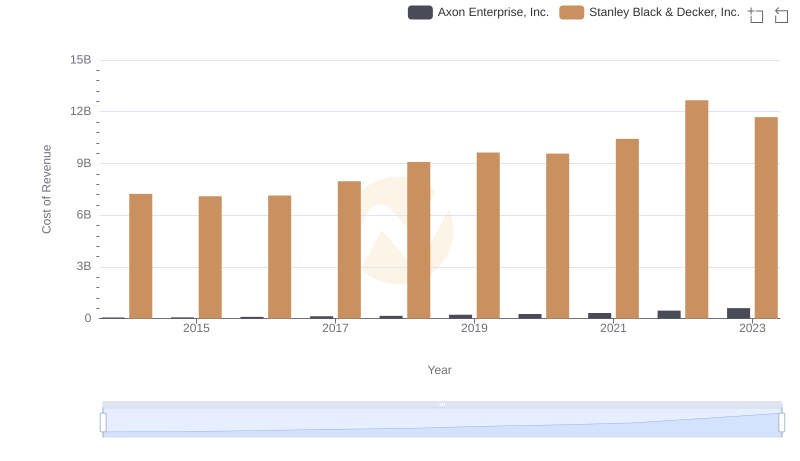
Cost of Revenue Trends: Axon Enterprise, Inc. vs Stanley Black & Decker, Inc.
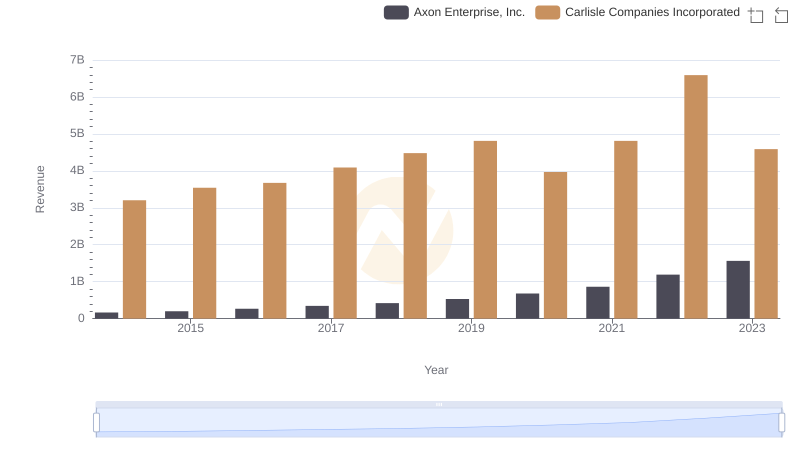
Axon Enterprise, Inc. and Carlisle Companies Incorporated: A Comprehensive Revenue Analysis

Cost of Revenue: Key Insights for Axon Enterprise, Inc. and Snap-on Incorporated
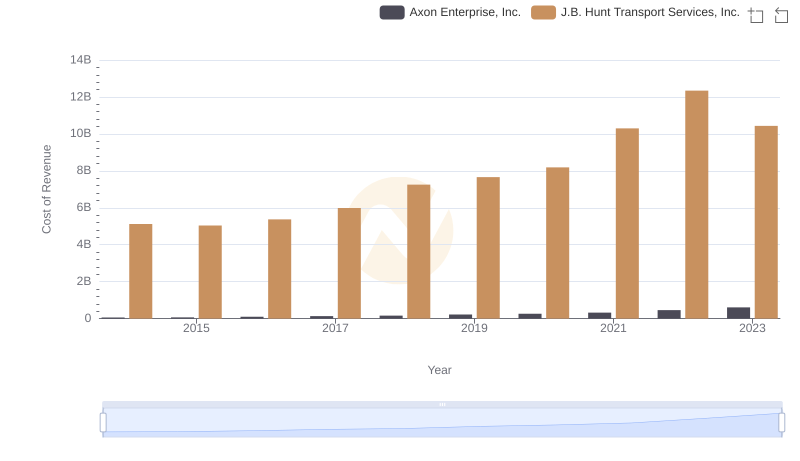
Cost of Revenue Trends: Axon Enterprise, Inc. vs J.B. Hunt Transport Services, Inc.
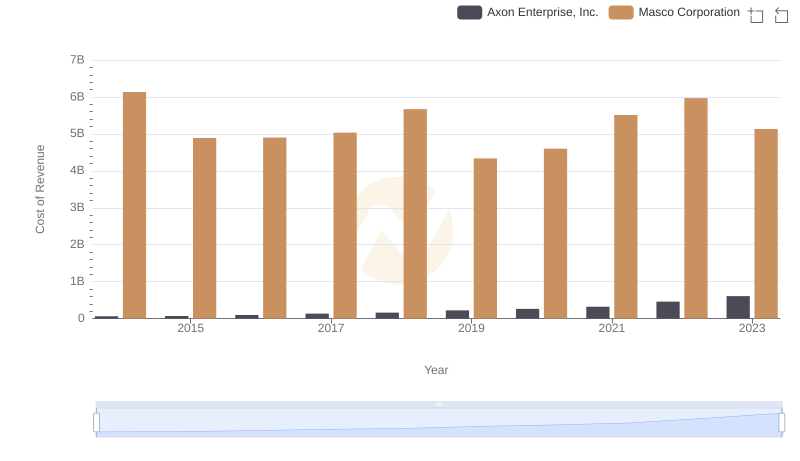
Cost of Revenue Comparison: Axon Enterprise, Inc. vs Masco Corporation
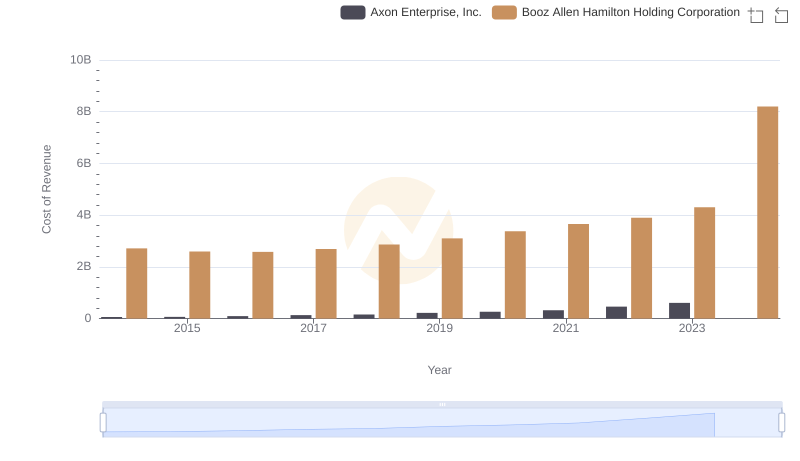
Cost of Revenue: Key Insights for Axon Enterprise, Inc. and Booz Allen Hamilton Holding Corporation
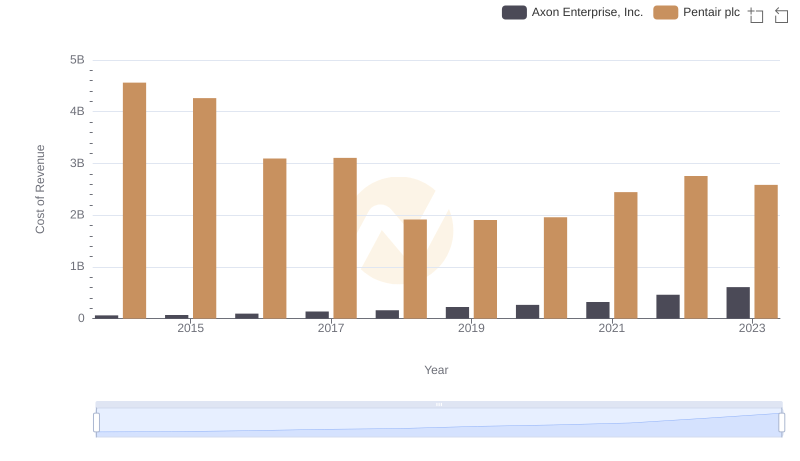
Axon Enterprise, Inc. vs Pentair plc: Efficiency in Cost of Revenue Explored
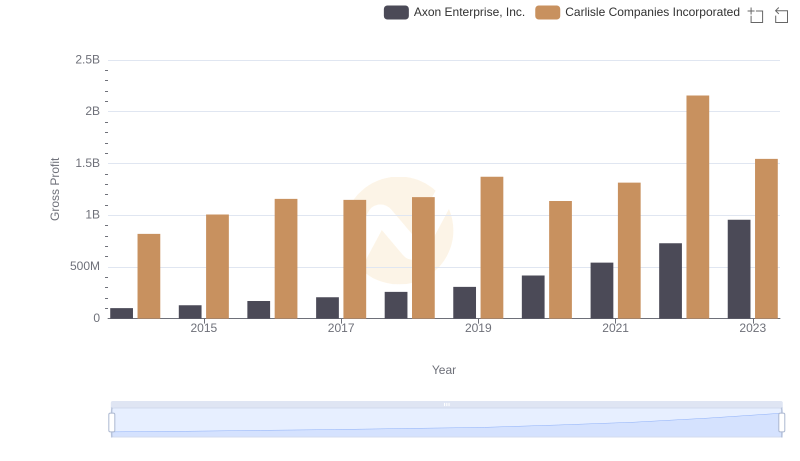
Gross Profit Trends Compared: Axon Enterprise, Inc. vs Carlisle Companies Incorporated
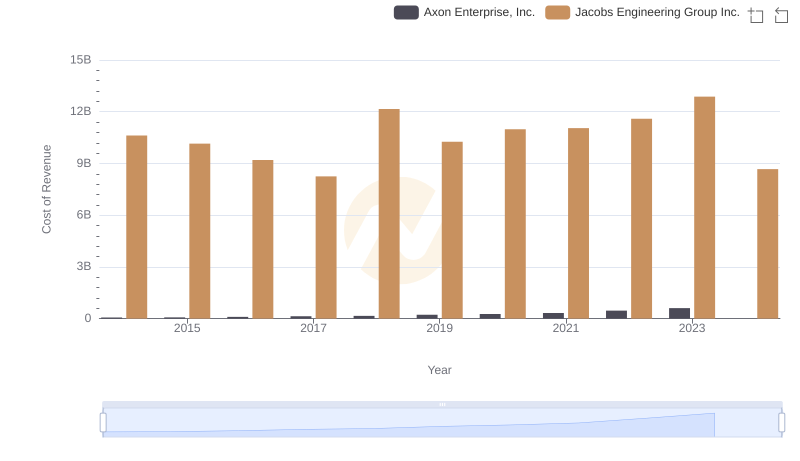
Analyzing Cost of Revenue: Axon Enterprise, Inc. and Jacobs Engineering Group Inc.
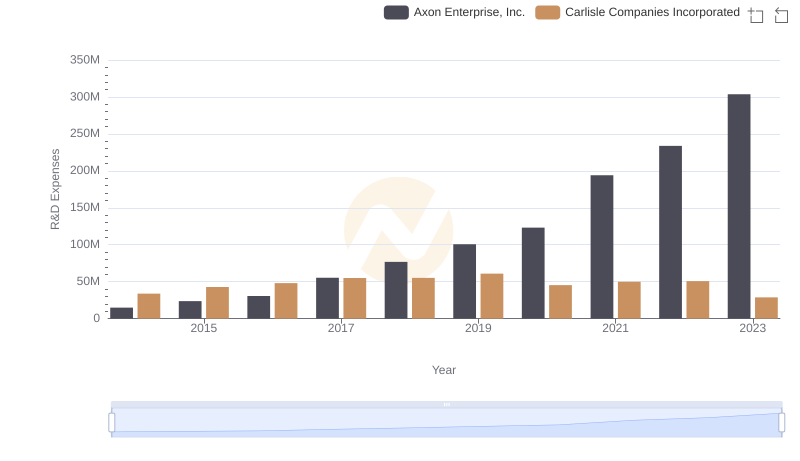
Analyzing R&D Budgets: Axon Enterprise, Inc. vs Carlisle Companies Incorporated
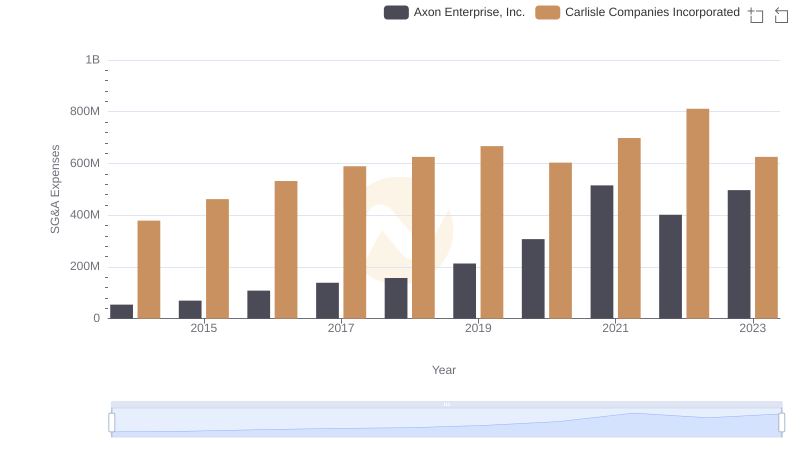
Breaking Down SG&A Expenses: Axon Enterprise, Inc. vs Carlisle Companies Incorporated