| __timestamp | TransUnion | United Rentals, Inc. |
|---|---|---|
| Wednesday, January 1, 2014 | 1304700000 | 5685000000 |
| Thursday, January 1, 2015 | 1506800000 | 5817000000 |
| Friday, January 1, 2016 | 1704900000 | 5762000000 |
| Sunday, January 1, 2017 | 1933800000 | 6641000000 |
| Monday, January 1, 2018 | 2317200000 | 8047000000 |
| Tuesday, January 1, 2019 | 2656100000 | 9351000000 |
| Wednesday, January 1, 2020 | 2716600000 | 8530000000 |
| Friday, January 1, 2021 | 2960200000 | 9716000000 |
| Saturday, January 1, 2022 | 3709900000 | 11642000000 |
| Sunday, January 1, 2023 | 3831200000 | 14332000000 |
| Monday, January 1, 2024 | 4183800000 | 15345000000 |
Unleashing insights
In the ever-evolving landscape of American business, two giants stand out for their impressive revenue trajectories over the past decade: United Rentals, Inc. and TransUnion. From 2014 to 2023, United Rentals, Inc. has consistently outperformed TransUnion, showcasing a robust growth pattern. Starting with a revenue of approximately $5.7 billion in 2014, United Rentals, Inc. has seen a remarkable increase of over 150%, reaching around $14.3 billion by 2023. In contrast, TransUnion began with a revenue of about $1.3 billion in 2014 and experienced a steady growth of nearly 200%, culminating in approximately $3.8 billion in 2023. This comparison highlights United Rentals, Inc.'s dominance in revenue generation, while TransUnion's growth rate underscores its potential in the financial services sector. Notably, data for 2024 is incomplete, leaving room for speculation on future trends.
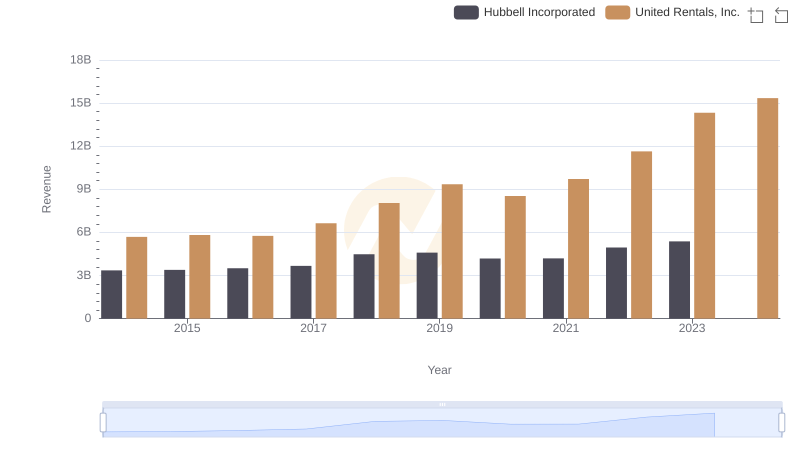
Revenue Showdown: United Rentals, Inc. vs Hubbell Incorporated
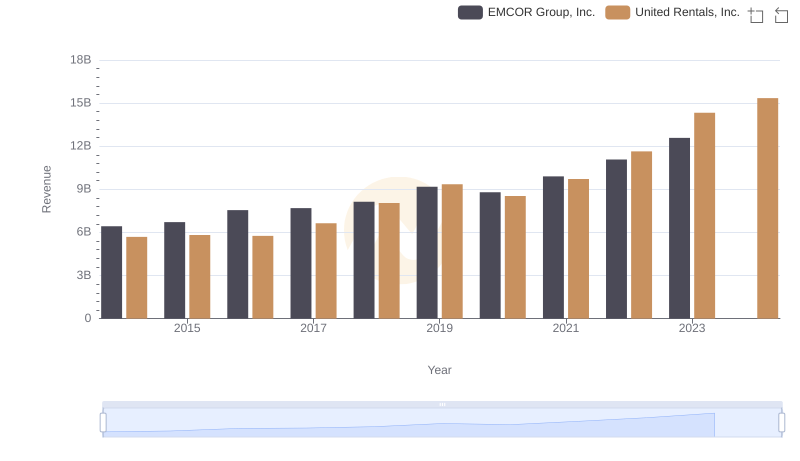
United Rentals, Inc. vs EMCOR Group, Inc.: Examining Key Revenue Metrics
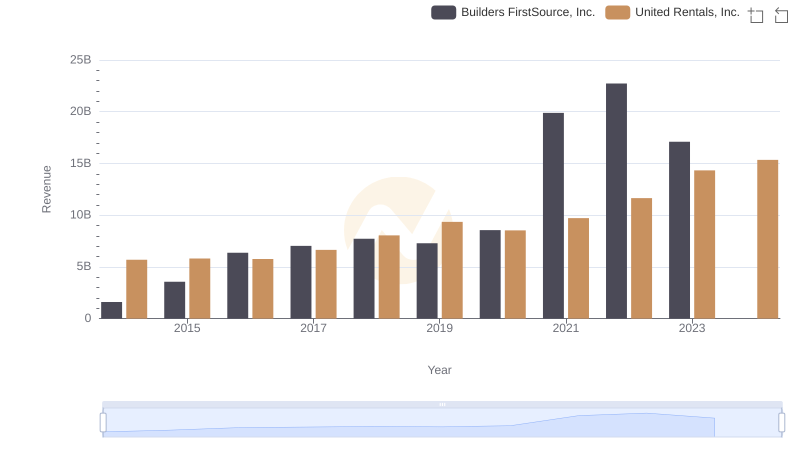
United Rentals, Inc. or Builders FirstSource, Inc.: Who Leads in Yearly Revenue?
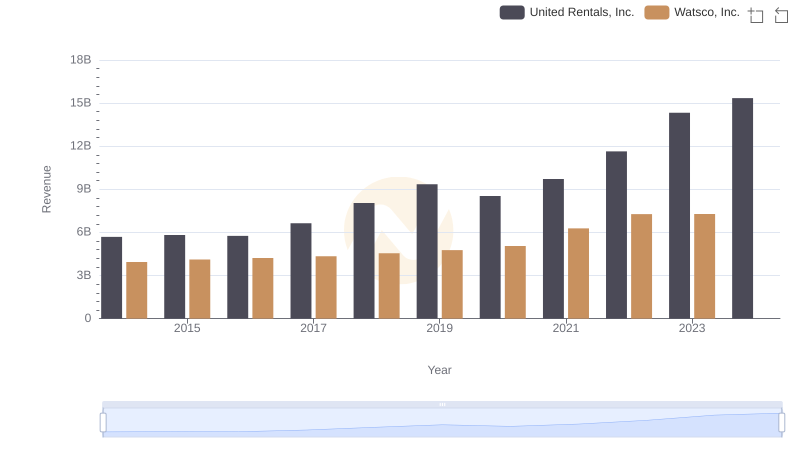
United Rentals, Inc. or Watsco, Inc.: Who Leads in Yearly Revenue?
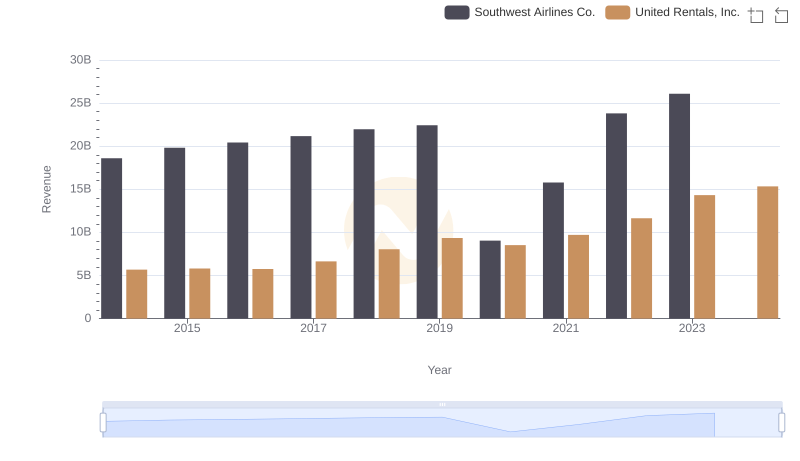
Comparing Revenue Performance: United Rentals, Inc. or Southwest Airlines Co.?
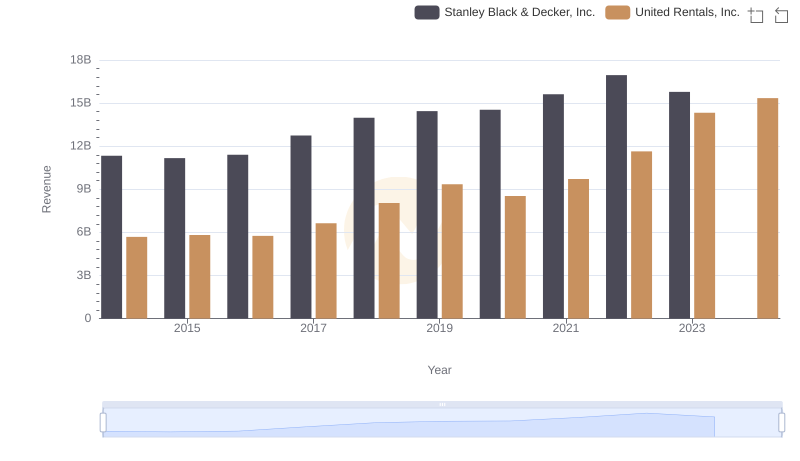
Comparing Revenue Performance: United Rentals, Inc. or Stanley Black & Decker, Inc.?
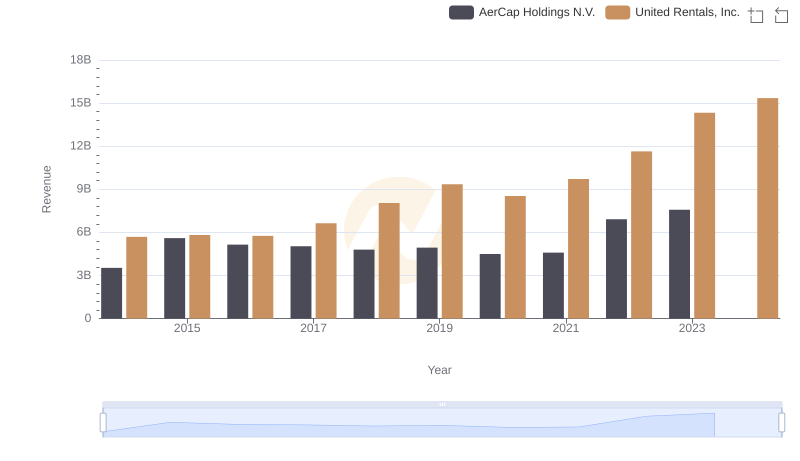
United Rentals, Inc. vs AerCap Holdings N.V.: Annual Revenue Growth Compared

Breaking Down Revenue Trends: United Rentals, Inc. vs Snap-on Incorporated
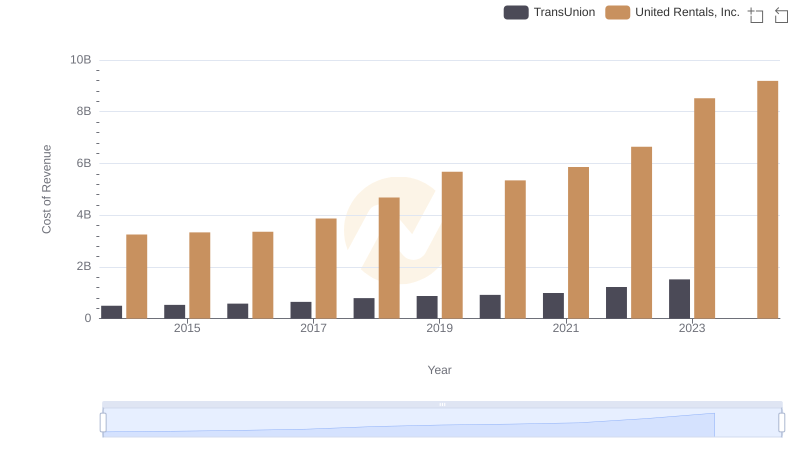
Cost of Revenue: Key Insights for United Rentals, Inc. and TransUnion
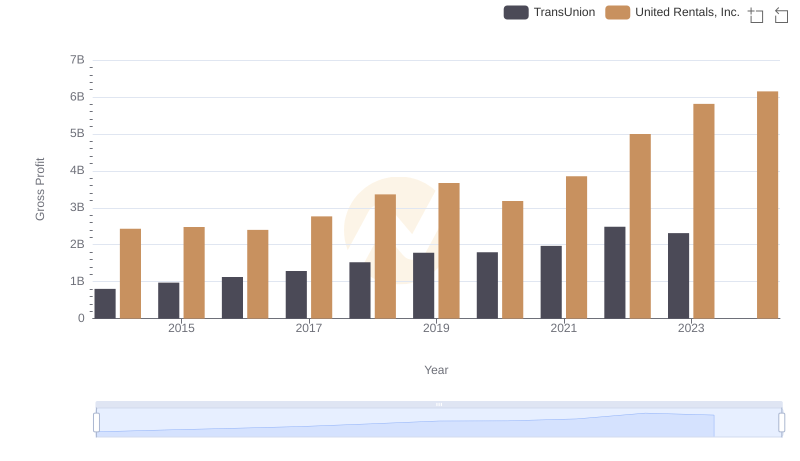
United Rentals, Inc. and TransUnion: A Detailed Gross Profit Analysis
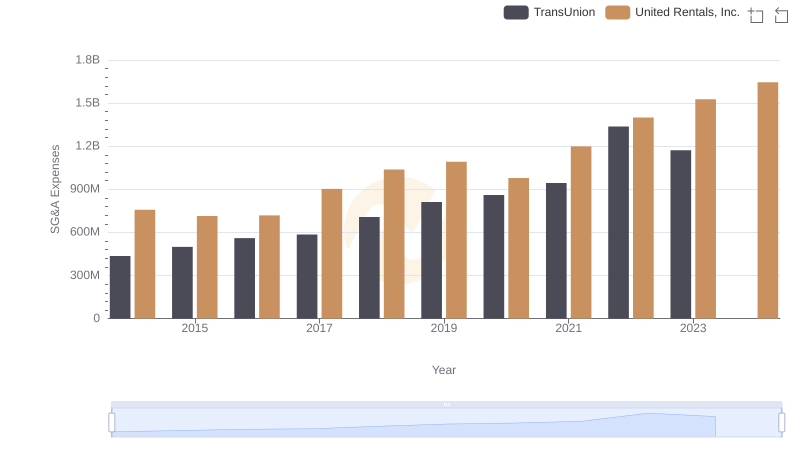
Breaking Down SG&A Expenses: United Rentals, Inc. vs TransUnion
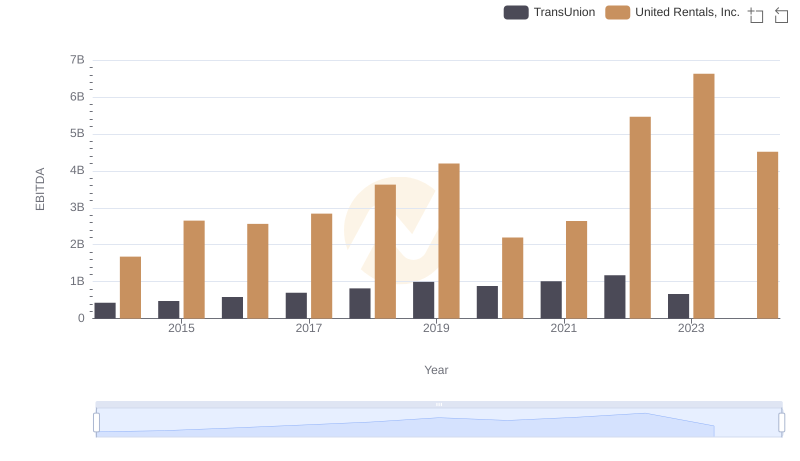
EBITDA Performance Review: United Rentals, Inc. vs TransUnion