| __timestamp | TransUnion | United Rentals, Inc. |
|---|---|---|
| Wednesday, January 1, 2014 | 429400000 | 1678000000 |
| Thursday, January 1, 2015 | 478200000 | 2653000000 |
| Friday, January 1, 2016 | 585300000 | 2566000000 |
| Sunday, January 1, 2017 | 701100000 | 2843000000 |
| Monday, January 1, 2018 | 819800000 | 3628000000 |
| Tuesday, January 1, 2019 | 993200000 | 4200000000 |
| Wednesday, January 1, 2020 | 883400000 | 2195000000 |
| Friday, January 1, 2021 | 1010500000 | 2642000000 |
| Saturday, January 1, 2022 | 1173800000 | 5464000000 |
| Sunday, January 1, 2023 | 667300000 | 6627000000 |
| Monday, January 1, 2024 | 1204100000 | 4516000000 |
Cracking the code
In the dynamic world of finance, EBITDA serves as a crucial indicator of a company's operational performance. This analysis juxtaposes the EBITDA trends of United Rentals, Inc. and TransUnion from 2014 to 2023.
United Rentals, Inc. has demonstrated a robust growth trajectory, with its EBITDA surging by nearly 295% over the decade. The company reached its peak in 2023, with an EBITDA of approximately $6.63 billion, showcasing its resilience and strategic prowess in the rental industry.
TransUnion, while not as aggressive in growth as United Rentals, has shown a steady increase in EBITDA, peaking in 2022 with $1.17 billion. Despite a dip in 2023, TransUnion's consistent performance underscores its stability in the credit reporting sector.
This comparative analysis highlights the diverse strategies and market conditions influencing these industry leaders.
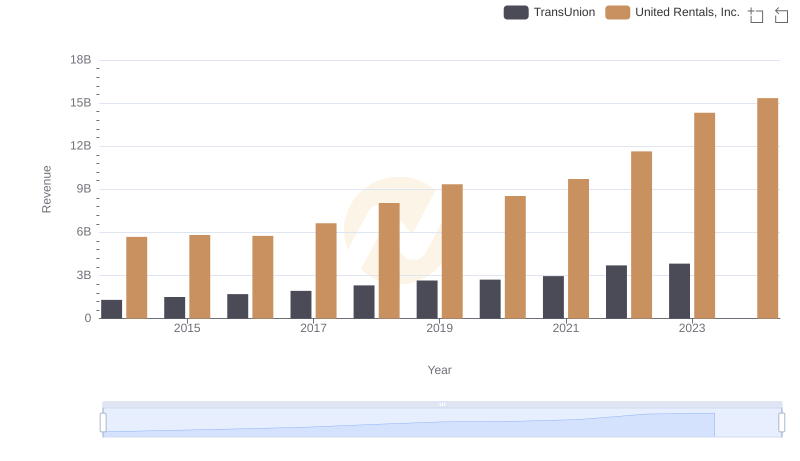
Comparing Revenue Performance: United Rentals, Inc. or TransUnion?
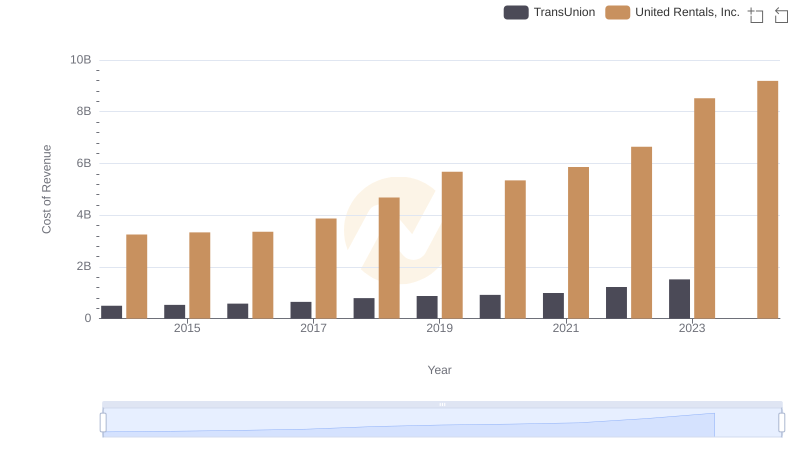
Cost of Revenue: Key Insights for United Rentals, Inc. and TransUnion
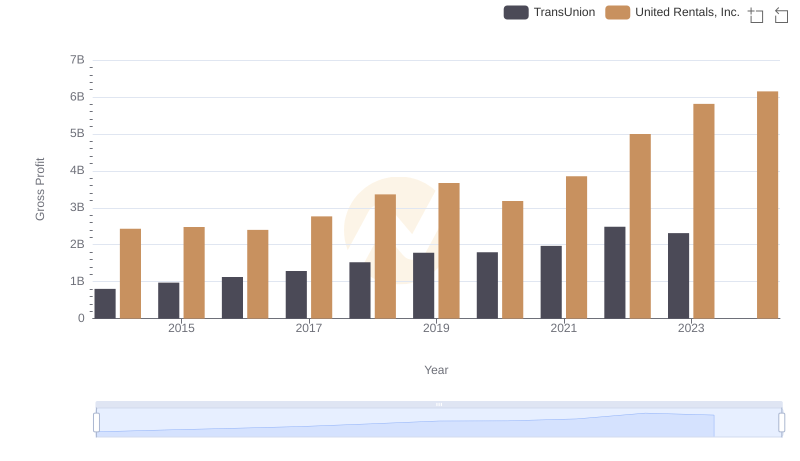
United Rentals, Inc. and TransUnion: A Detailed Gross Profit Analysis
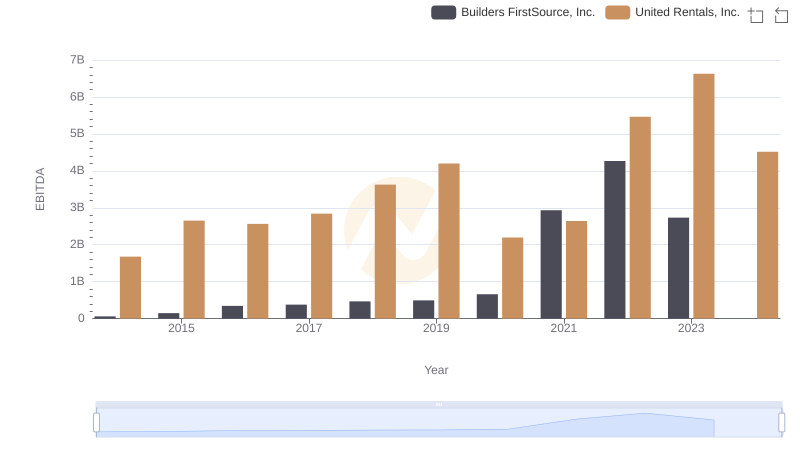
United Rentals, Inc. vs Builders FirstSource, Inc.: In-Depth EBITDA Performance Comparison
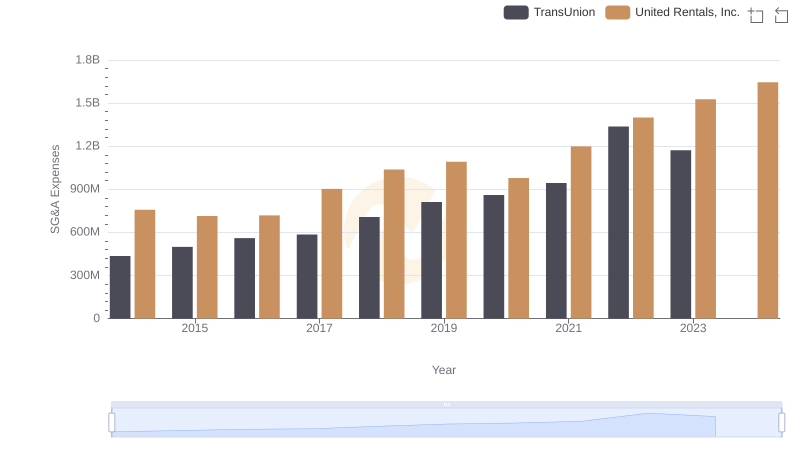
Breaking Down SG&A Expenses: United Rentals, Inc. vs TransUnion
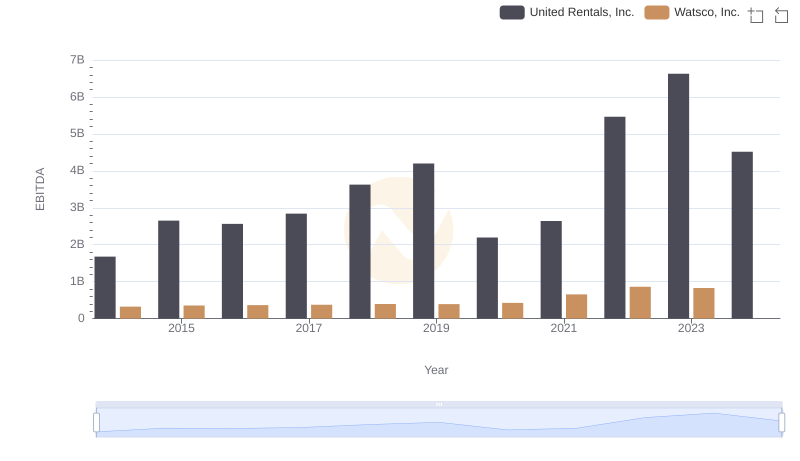
EBITDA Analysis: Evaluating United Rentals, Inc. Against Watsco, Inc.
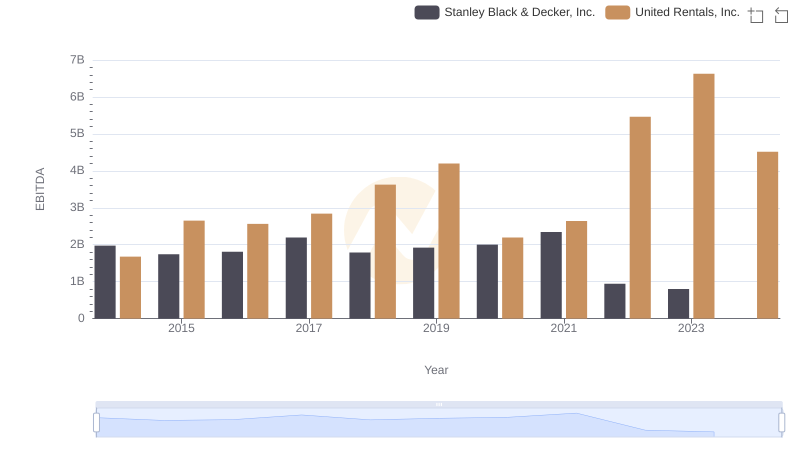
A Side-by-Side Analysis of EBITDA: United Rentals, Inc. and Stanley Black & Decker, Inc.
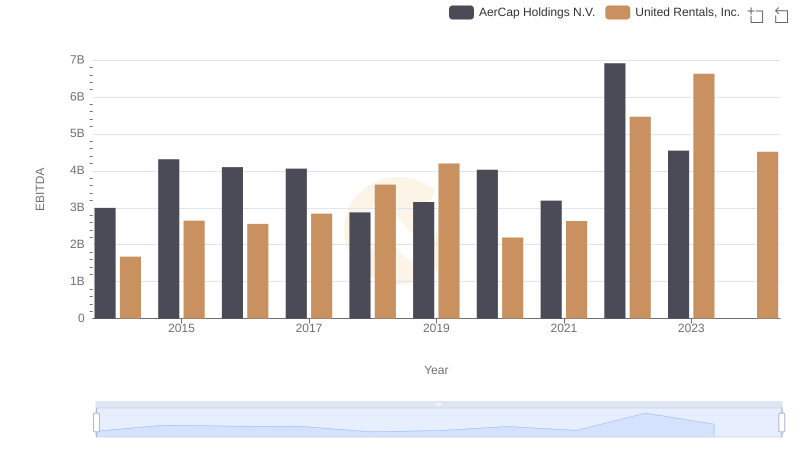
Comparative EBITDA Analysis: United Rentals, Inc. vs AerCap Holdings N.V.
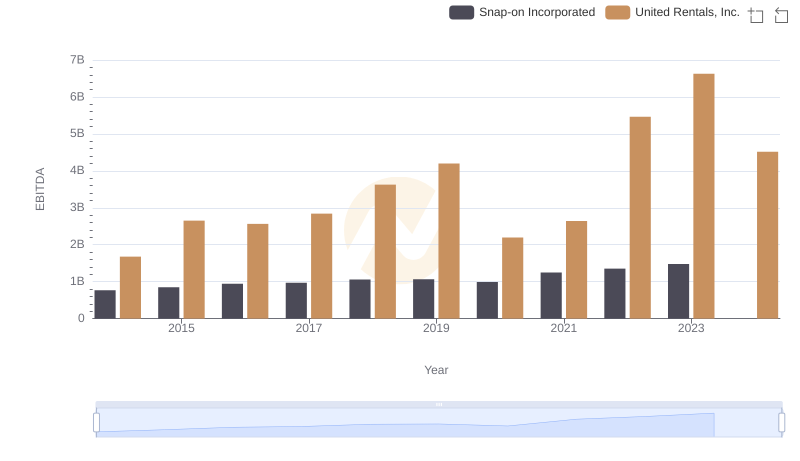
Comparative EBITDA Analysis: United Rentals, Inc. vs Snap-on Incorporated
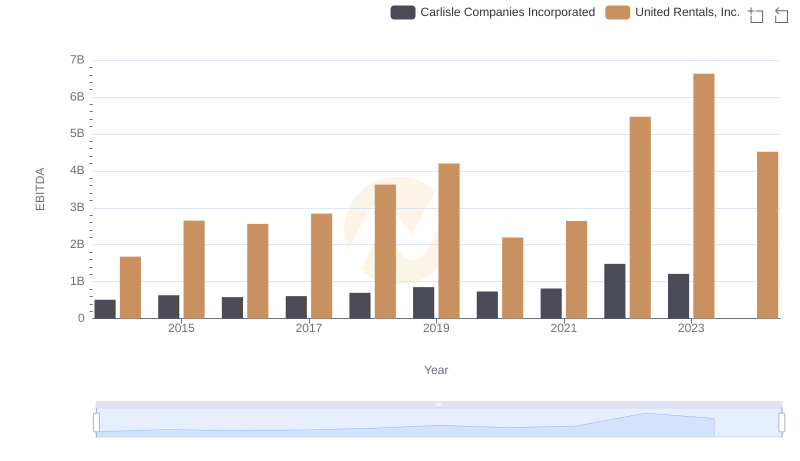
EBITDA Analysis: Evaluating United Rentals, Inc. Against Carlisle Companies Incorporated

United Rentals, Inc. and Masco Corporation: A Detailed Examination of EBITDA Performance
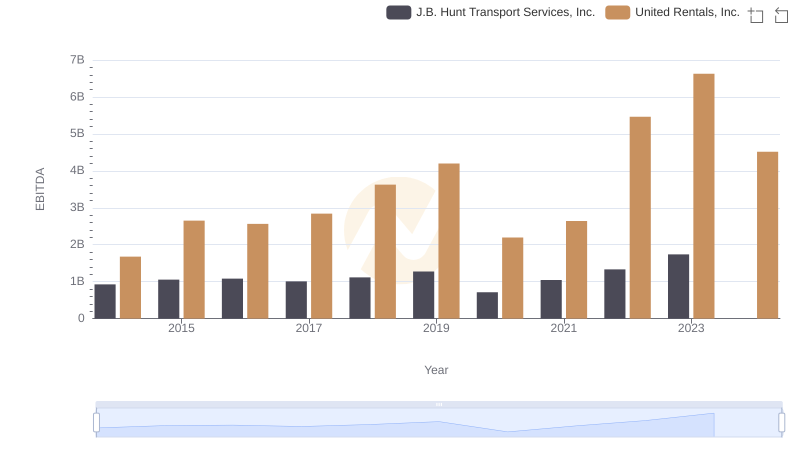
EBITDA Analysis: Evaluating United Rentals, Inc. Against J.B. Hunt Transport Services, Inc.