| __timestamp | Autodesk, Inc. | Intuit Inc. |
|---|---|---|
| Wednesday, January 1, 2014 | 274300000 | 668000000 |
| Thursday, January 1, 2015 | 342100000 | 725000000 |
| Friday, January 1, 2016 | 370700000 | 752000000 |
| Sunday, January 1, 2017 | 341900000 | 809000000 |
| Monday, January 1, 2018 | 303400000 | 977000000 |
| Tuesday, January 1, 2019 | 285900000 | 1167000000 |
| Wednesday, January 1, 2020 | 324900000 | 1378000000 |
| Friday, January 1, 2021 | 337100000 | 1683000000 |
| Saturday, January 1, 2022 | 418500000 | 2406000000 |
| Sunday, January 1, 2023 | 480000000 | 3143000000 |
| Monday, January 1, 2024 | 463000000 | 3465000000 |
In pursuit of knowledge
In the ever-evolving landscape of software giants, Intuit Inc. and Autodesk, Inc. have shown distinct trajectories in their cost of revenue from 2014 to 2024. Intuit's cost of revenue has surged by over 400%, reflecting its aggressive expansion and increased operational scale. In contrast, Autodesk's cost of revenue has grown by approximately 86%, indicating a more measured approach to scaling its operations.
These trends underscore the strategic differences between the two companies, with Intuit focusing on rapid expansion and Autodesk maintaining a steady growth path.
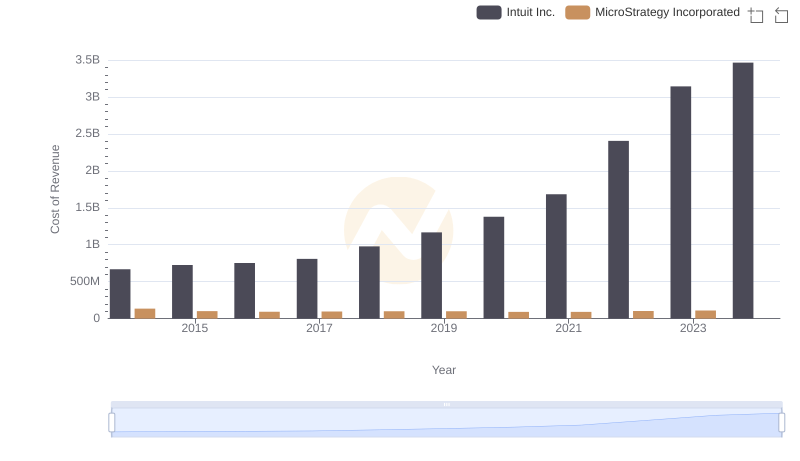
Analyzing Cost of Revenue: Intuit Inc. and MicroStrategy Incorporated
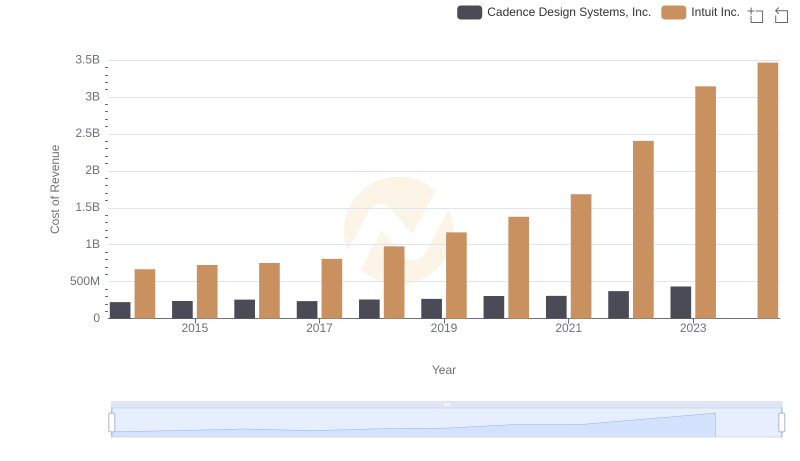
Cost of Revenue Trends: Intuit Inc. vs Cadence Design Systems, Inc.
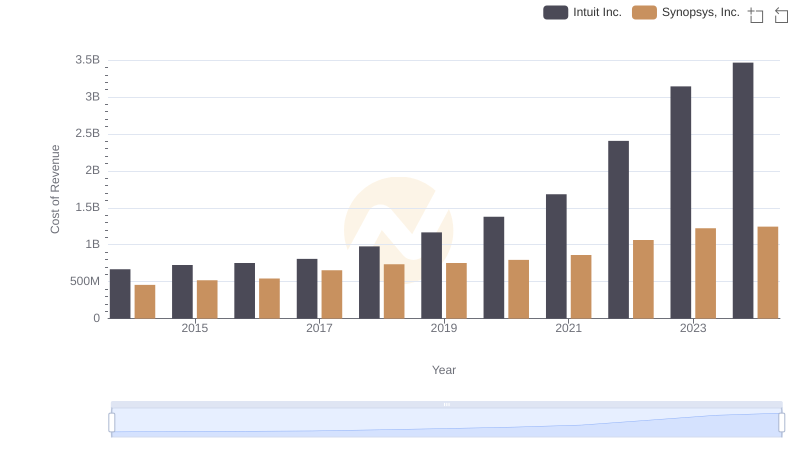
Comparing Cost of Revenue Efficiency: Intuit Inc. vs Synopsys, Inc.
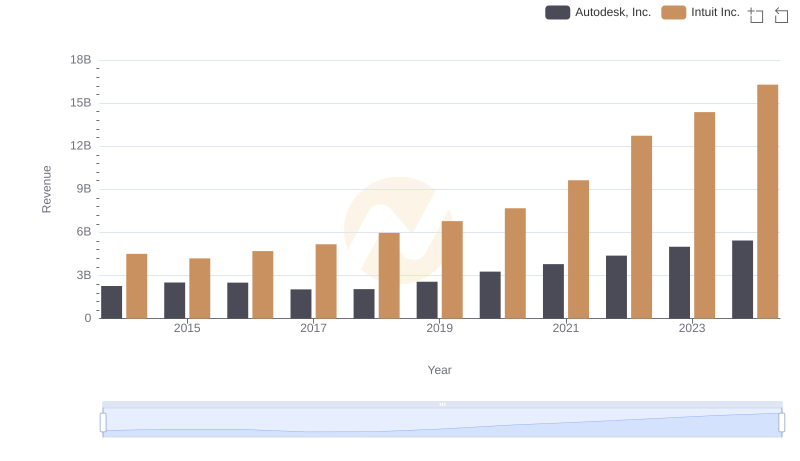
Revenue Showdown: Intuit Inc. vs Autodesk, Inc.
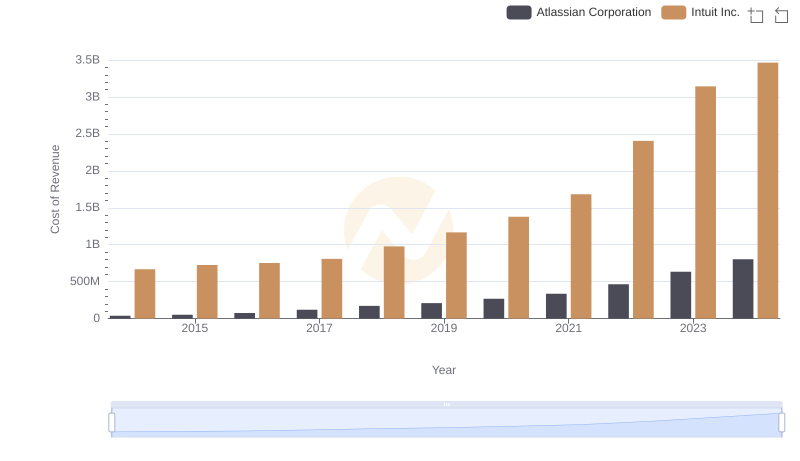
Analyzing Cost of Revenue: Intuit Inc. and Atlassian Corporation
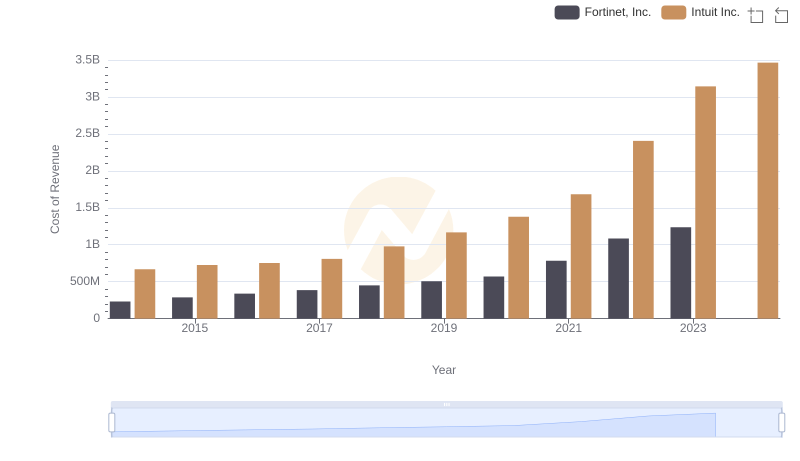
Comparing Cost of Revenue Efficiency: Intuit Inc. vs Fortinet, Inc.
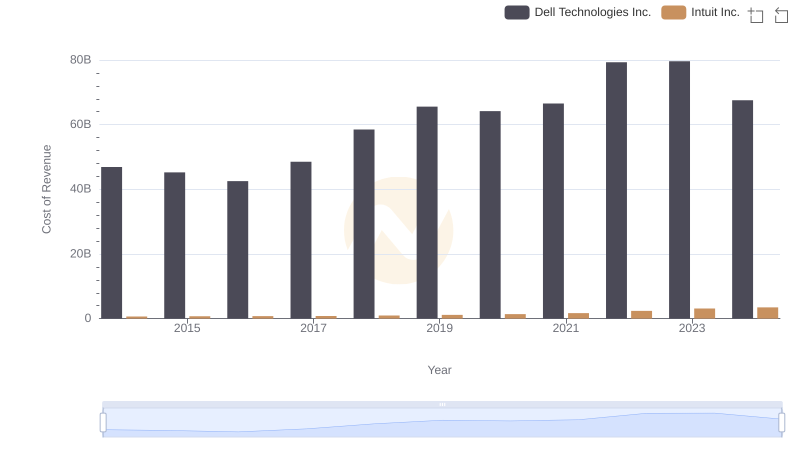
Cost of Revenue: Key Insights for Intuit Inc. and Dell Technologies Inc.
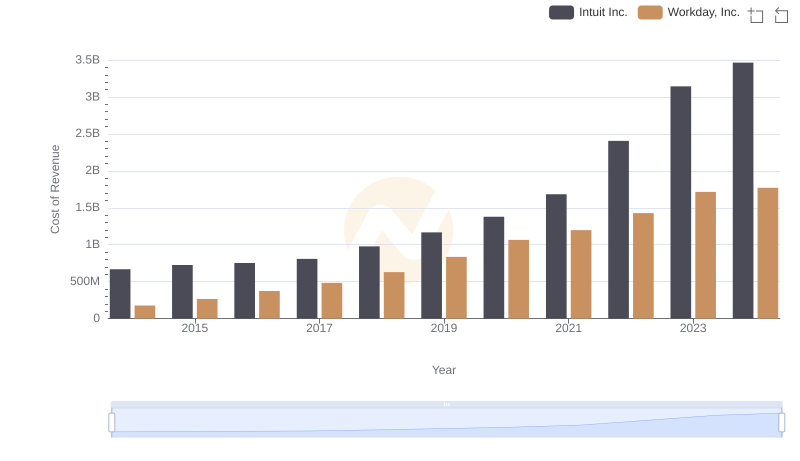
Comparing Cost of Revenue Efficiency: Intuit Inc. vs Workday, Inc.
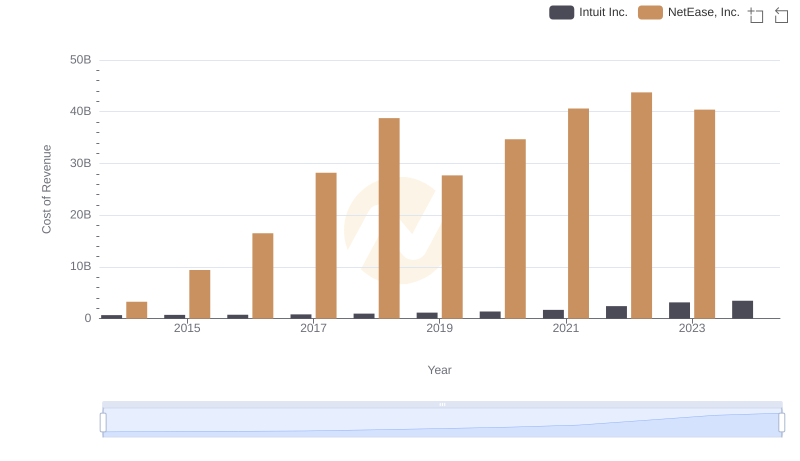
Cost of Revenue: Key Insights for Intuit Inc. and NetEase, Inc.

Key Insights on Gross Profit: Intuit Inc. vs Autodesk, Inc.
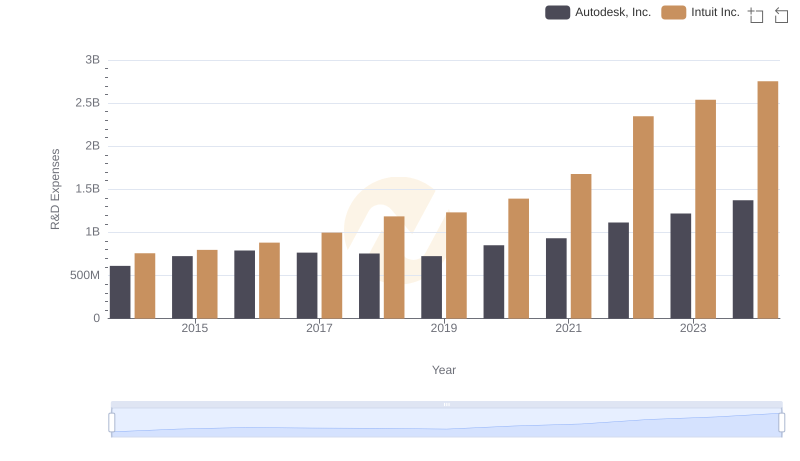
Research and Development Investment: Intuit Inc. vs Autodesk, Inc.
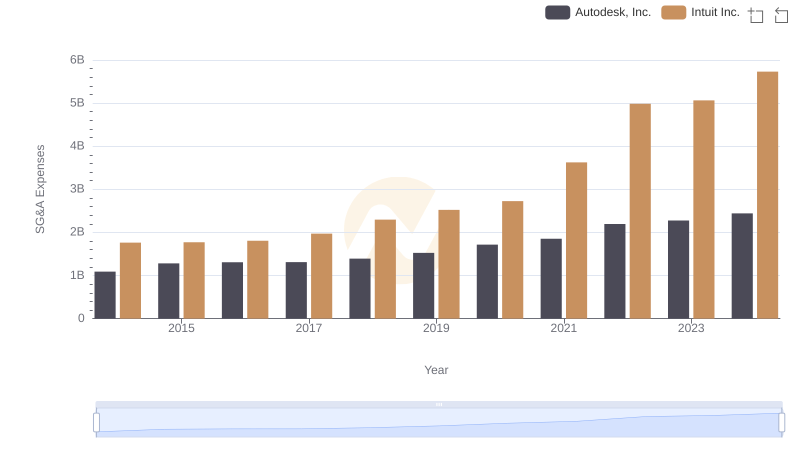
Intuit Inc. vs Autodesk, Inc.: SG&A Expense Trends