| __timestamp | Dell Technologies Inc. | Intuit Inc. |
|---|---|---|
| Wednesday, January 1, 2014 | 46892000000 | 668000000 |
| Thursday, January 1, 2015 | 45246000000 | 725000000 |
| Friday, January 1, 2016 | 42524000000 | 752000000 |
| Sunday, January 1, 2017 | 48515000000 | 809000000 |
| Monday, January 1, 2018 | 58503000000 | 977000000 |
| Tuesday, January 1, 2019 | 65568000000 | 1167000000 |
| Wednesday, January 1, 2020 | 64176000000 | 1378000000 |
| Friday, January 1, 2021 | 66530000000 | 1683000000 |
| Saturday, January 1, 2022 | 79306000000 | 2406000000 |
| Sunday, January 1, 2023 | 79615000000 | 3143000000 |
| Monday, January 1, 2024 | 67556000000 | 3465000000 |
Unveiling the hidden dimensions of data
In the ever-evolving landscape of technology, understanding the cost of revenue is crucial for assessing a company's financial health. Over the past decade, Dell Technologies Inc. and Intuit Inc. have shown distinct trajectories in their cost of revenue. From 2014 to 2023, Dell's cost of revenue surged by approximately 70%, peaking in 2023, while Intuit's increased by nearly 370%, reflecting its aggressive growth strategy. Notably, Dell's cost of revenue consistently remained over 40 times higher than Intuit's, highlighting the scale difference between the two giants. The year 2022 marked a significant leap for both companies, with Dell reaching its highest cost of revenue at $79.3 billion and Intuit at $2.4 billion. As we look to 2024, these trends offer valuable insights into the operational strategies and market positioning of these industry leaders.
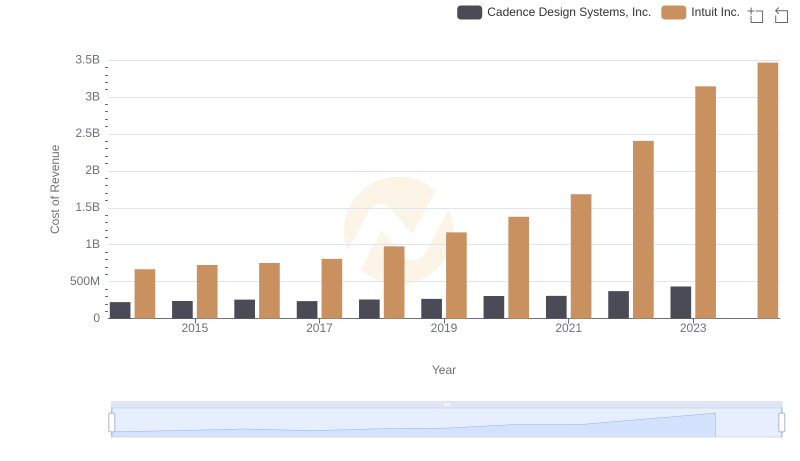
Cost of Revenue Trends: Intuit Inc. vs Cadence Design Systems, Inc.
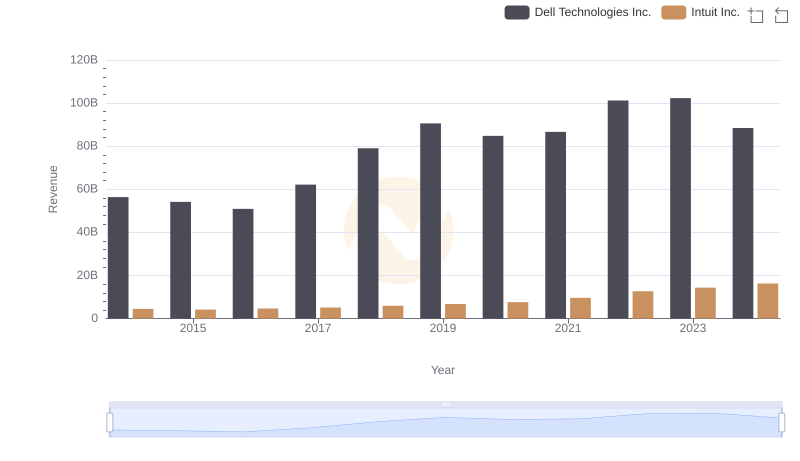
Intuit Inc. or Dell Technologies Inc.: Who Leads in Yearly Revenue?
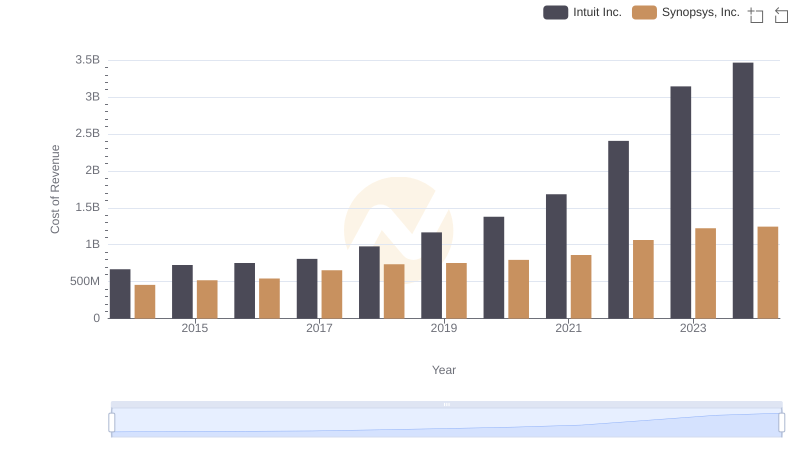
Comparing Cost of Revenue Efficiency: Intuit Inc. vs Synopsys, Inc.
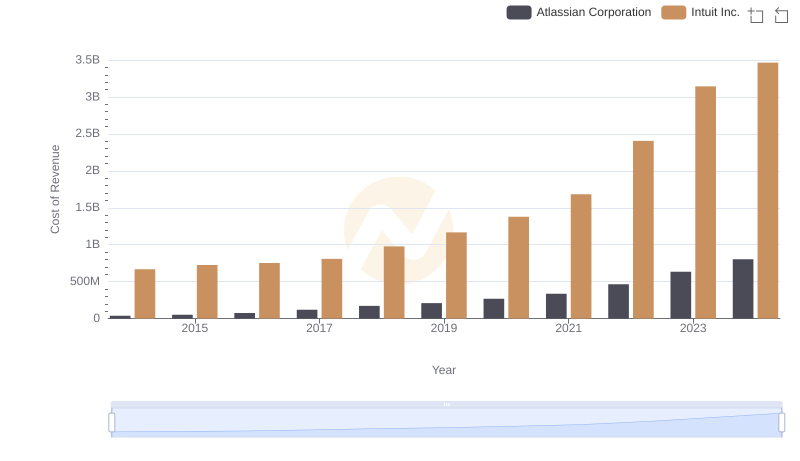
Analyzing Cost of Revenue: Intuit Inc. and Atlassian Corporation
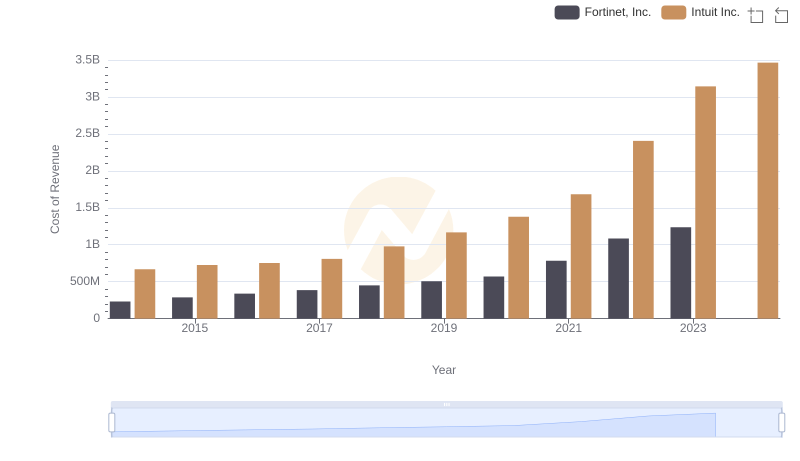
Comparing Cost of Revenue Efficiency: Intuit Inc. vs Fortinet, Inc.
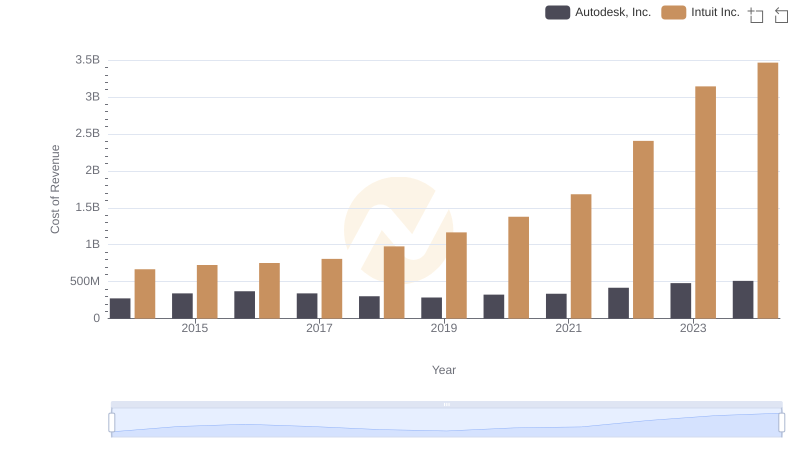
Cost of Revenue: Key Insights for Intuit Inc. and Autodesk, Inc.
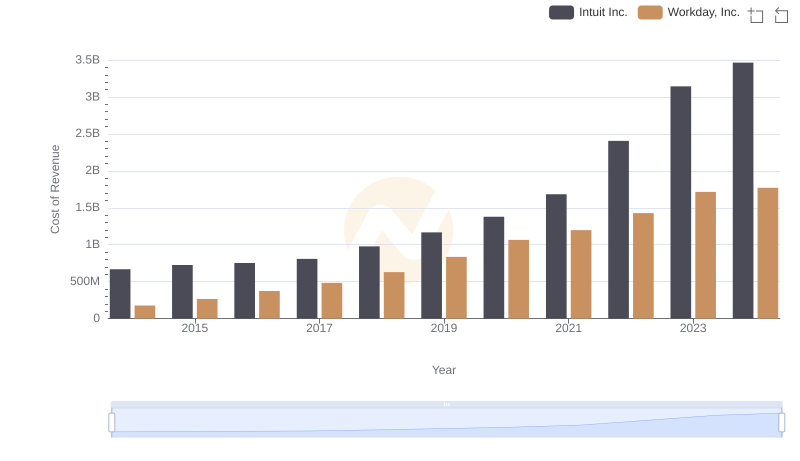
Comparing Cost of Revenue Efficiency: Intuit Inc. vs Workday, Inc.
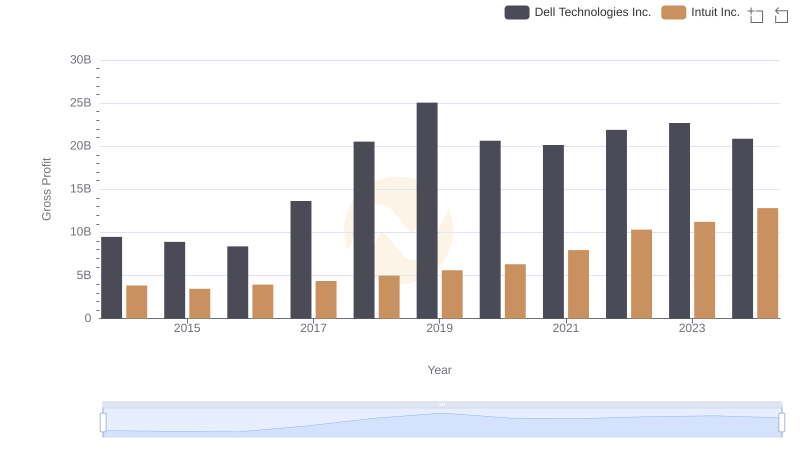
Intuit Inc. and Dell Technologies Inc.: A Detailed Gross Profit Analysis
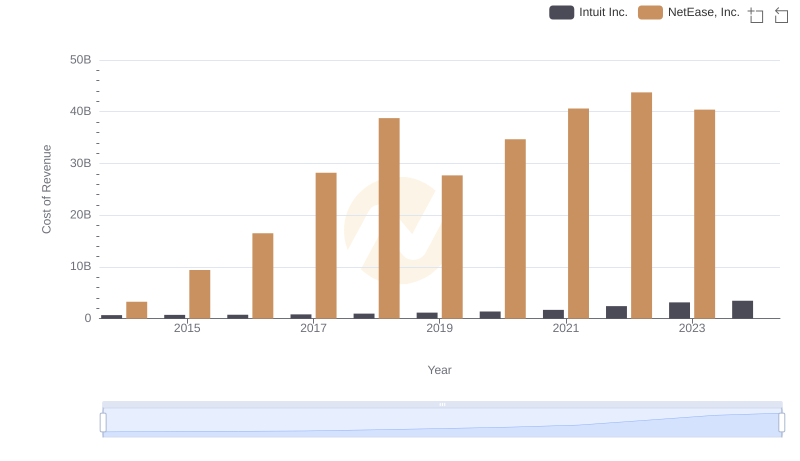
Cost of Revenue: Key Insights for Intuit Inc. and NetEase, Inc.
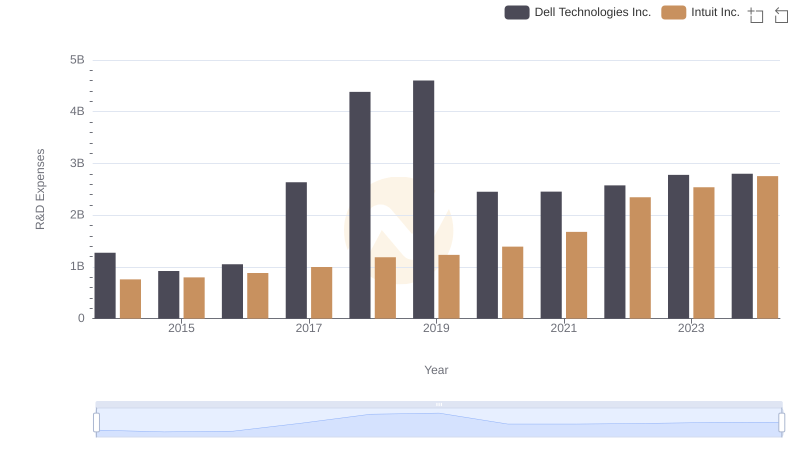
Intuit Inc. vs Dell Technologies Inc.: Strategic Focus on R&D Spending
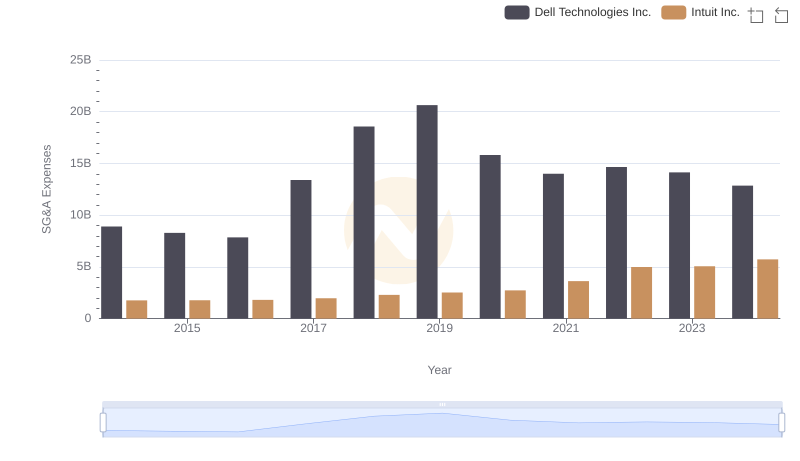
Operational Costs Compared: SG&A Analysis of Intuit Inc. and Dell Technologies Inc.
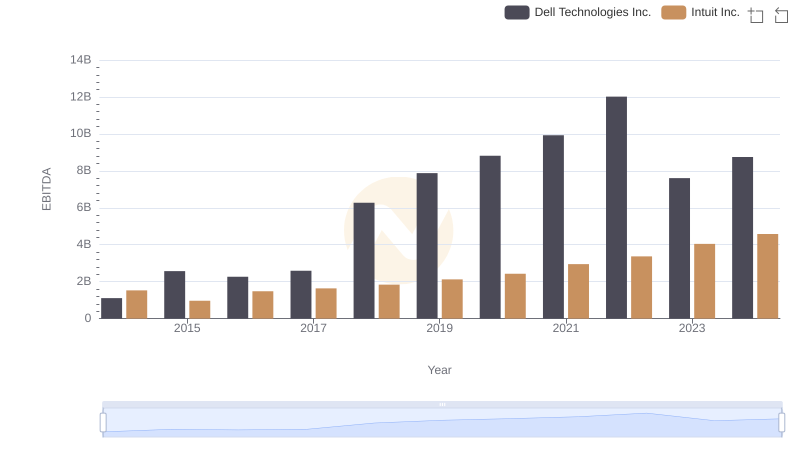
Intuit Inc. vs Dell Technologies Inc.: In-Depth EBITDA Performance Comparison