| __timestamp | Intuit Inc. | Workday, Inc. |
|---|---|---|
| Wednesday, January 1, 2014 | 668000000 | 176810000 |
| Thursday, January 1, 2015 | 725000000 | 264803000 |
| Friday, January 1, 2016 | 752000000 | 374427000 |
| Sunday, January 1, 2017 | 809000000 | 483545000 |
| Monday, January 1, 2018 | 977000000 | 629413000 |
| Tuesday, January 1, 2019 | 1167000000 | 834950000 |
| Wednesday, January 1, 2020 | 1378000000 | 1065258000 |
| Friday, January 1, 2021 | 1683000000 | 1198132000 |
| Saturday, January 1, 2022 | 2406000000 | 1428095000 |
| Sunday, January 1, 2023 | 3143000000 | 1715178000 |
| Monday, January 1, 2024 | 3465000000 | 1771000000 |
Unleashing the power of data
In the ever-evolving landscape of financial technology, Intuit Inc. and Workday, Inc. have emerged as key players. Over the past decade, from 2014 to 2024, these companies have demonstrated distinct trajectories in their cost of revenue efficiency. Intuit Inc. has seen a remarkable increase, with its cost of revenue growing by over 400%, from approximately $668 million in 2014 to $3.465 billion in 2024. This growth reflects Intuit's expanding market presence and operational scale.
Conversely, Workday, Inc. has also experienced significant growth, albeit at a more moderate pace. Its cost of revenue increased by nearly 900%, from $177 million in 2014 to $1.771 billion in 2024. This trend underscores Workday's strategic investments in cloud-based solutions and its commitment to innovation. As these companies continue to evolve, their cost of revenue efficiency will remain a critical metric for investors and stakeholders alike.
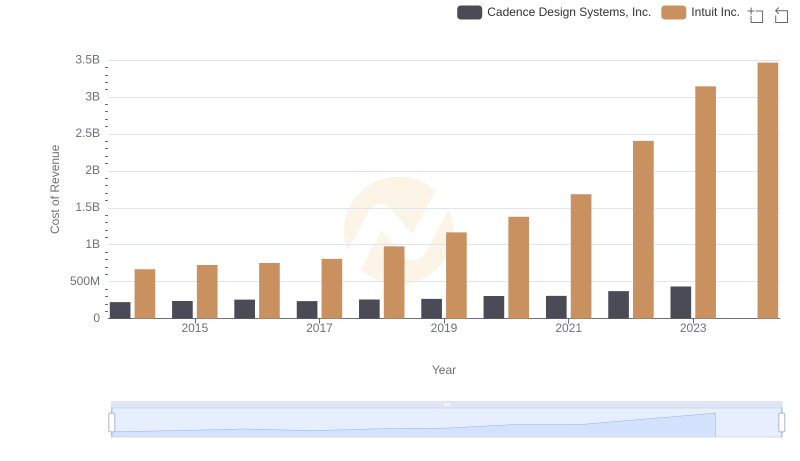
Cost of Revenue Trends: Intuit Inc. vs Cadence Design Systems, Inc.
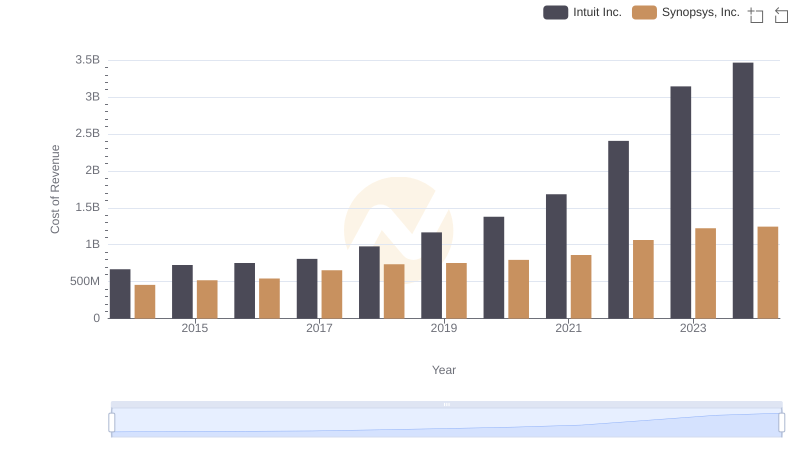
Comparing Cost of Revenue Efficiency: Intuit Inc. vs Synopsys, Inc.
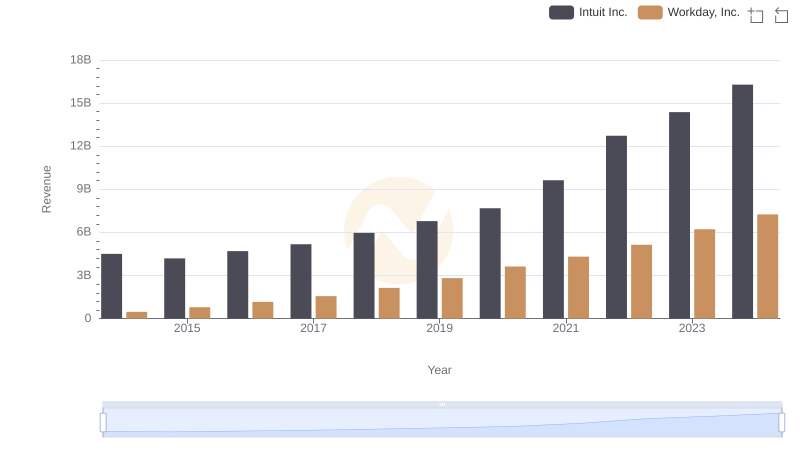
Intuit Inc. vs Workday, Inc.: Annual Revenue Growth Compared
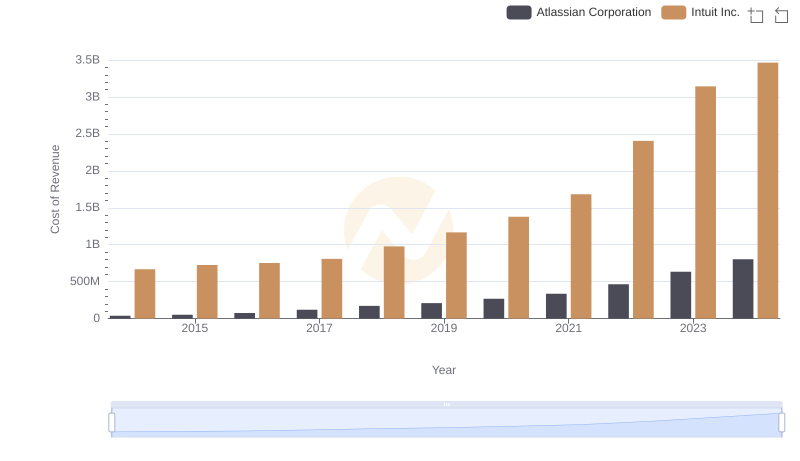
Analyzing Cost of Revenue: Intuit Inc. and Atlassian Corporation
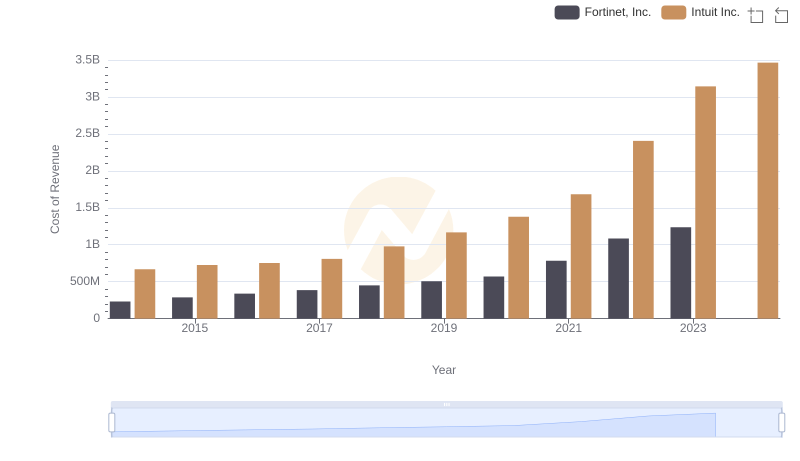
Comparing Cost of Revenue Efficiency: Intuit Inc. vs Fortinet, Inc.
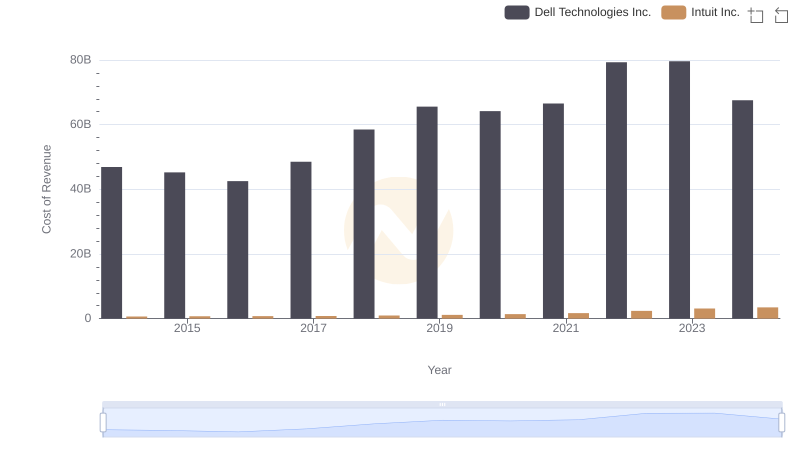
Cost of Revenue: Key Insights for Intuit Inc. and Dell Technologies Inc.
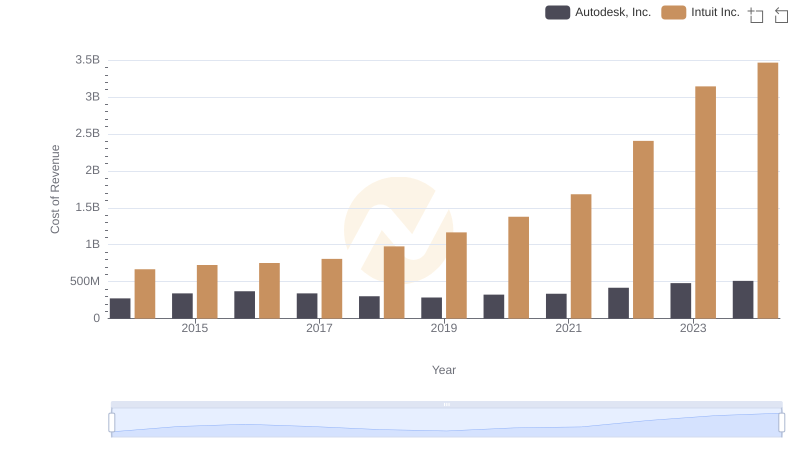
Cost of Revenue: Key Insights for Intuit Inc. and Autodesk, Inc.
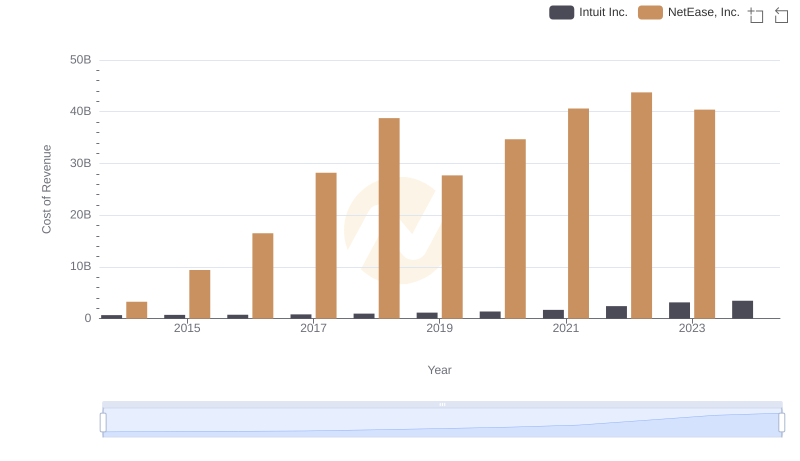
Cost of Revenue: Key Insights for Intuit Inc. and NetEase, Inc.
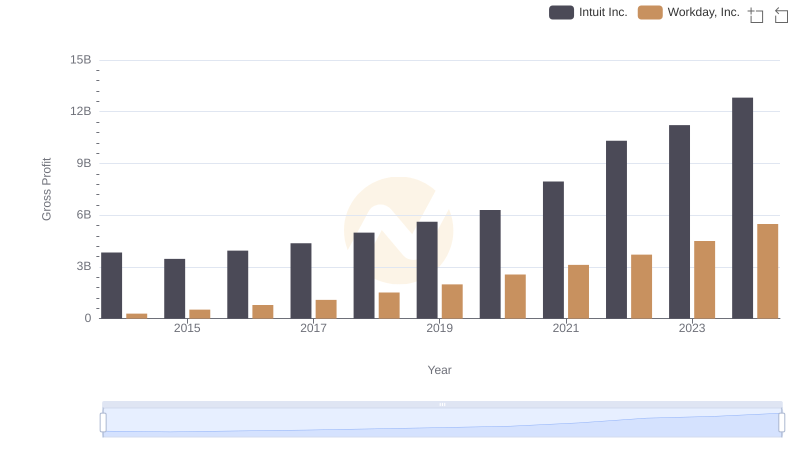
Gross Profit Comparison: Intuit Inc. and Workday, Inc. Trends
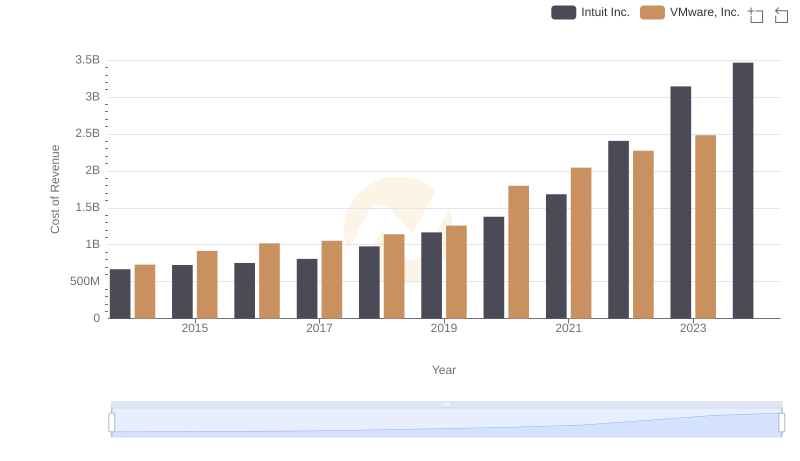
Analyzing Cost of Revenue: Intuit Inc. and VMware, Inc.
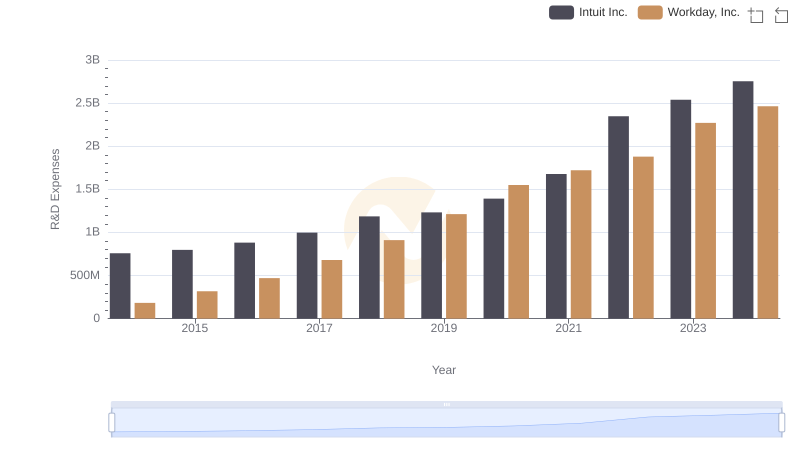
Research and Development Expenses Breakdown: Intuit Inc. vs Workday, Inc.
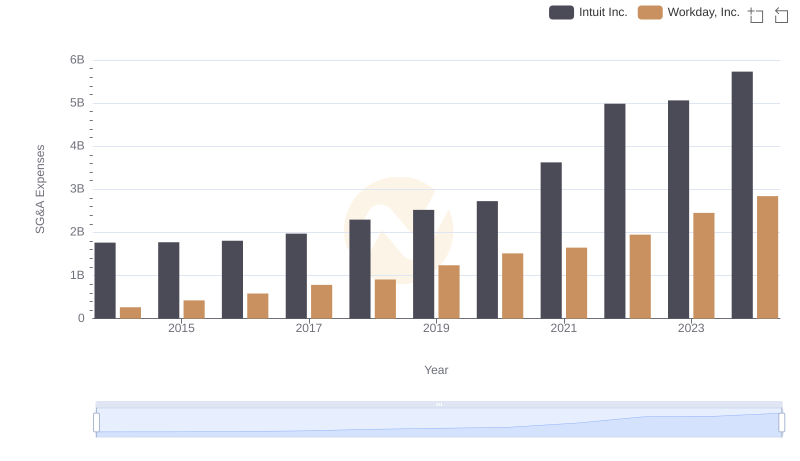
Intuit Inc. and Workday, Inc.: SG&A Spending Patterns Compared