| __timestamp | United Rentals, Inc. | Verisk Analytics, Inc. |
|---|---|---|
| Wednesday, January 1, 2014 | 3253000000 | 716598000 |
| Thursday, January 1, 2015 | 3337000000 | 803274000 |
| Friday, January 1, 2016 | 3359000000 | 714400000 |
| Sunday, January 1, 2017 | 3872000000 | 783800000 |
| Monday, January 1, 2018 | 4683000000 | 886200000 |
| Tuesday, January 1, 2019 | 5681000000 | 976800000 |
| Wednesday, January 1, 2020 | 5347000000 | 993900000 |
| Friday, January 1, 2021 | 5863000000 | 1057800000 |
| Saturday, January 1, 2022 | 6646000000 | 824600000 |
| Sunday, January 1, 2023 | 8519000000 | 876500000 |
| Monday, January 1, 2024 | 9195000000 |
Unleashing the power of data
In the ever-evolving landscape of American business, United Rentals, Inc. and Verisk Analytics, Inc. stand as titans in their respective industries. Over the past decade, United Rentals has seen its cost of revenue soar by approximately 183%, from $3.3 billion in 2014 to an impressive $9.2 billion in 2024. This growth reflects the company's aggressive expansion and strategic acquisitions. In contrast, Verisk Analytics, a leader in data analytics, has maintained a more stable trajectory, with its cost of revenue peaking at around $1.06 billion in 2021, before slightly declining. This stability underscores Verisk's efficient operational model. Notably, data for Verisk in 2024 is missing, highlighting potential gaps in reporting or strategic shifts. As these companies navigate the complexities of their industries, their financial strategies offer valuable insights into managing growth and efficiency.
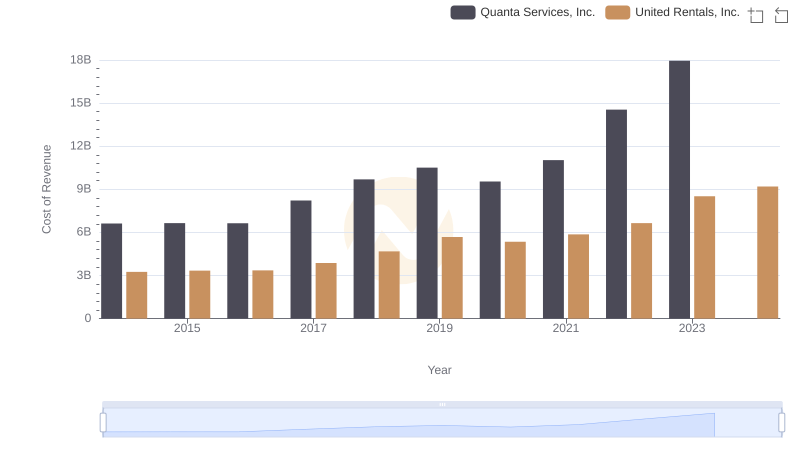
United Rentals, Inc. vs Quanta Services, Inc.: Efficiency in Cost of Revenue Explored
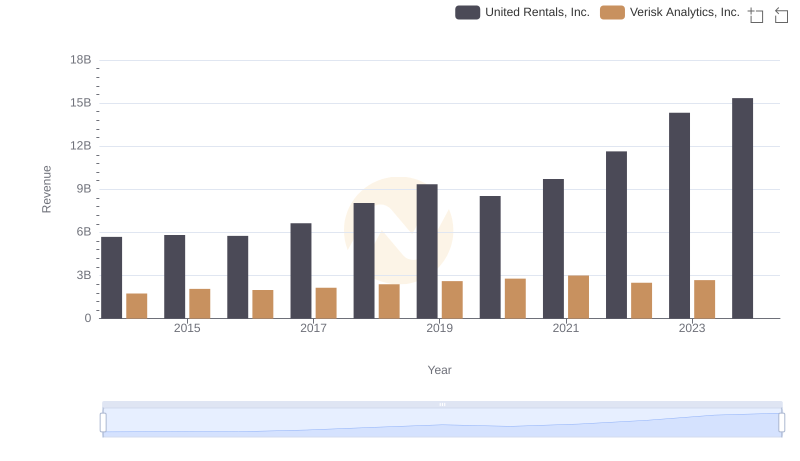
Revenue Insights: United Rentals, Inc. and Verisk Analytics, Inc. Performance Compared
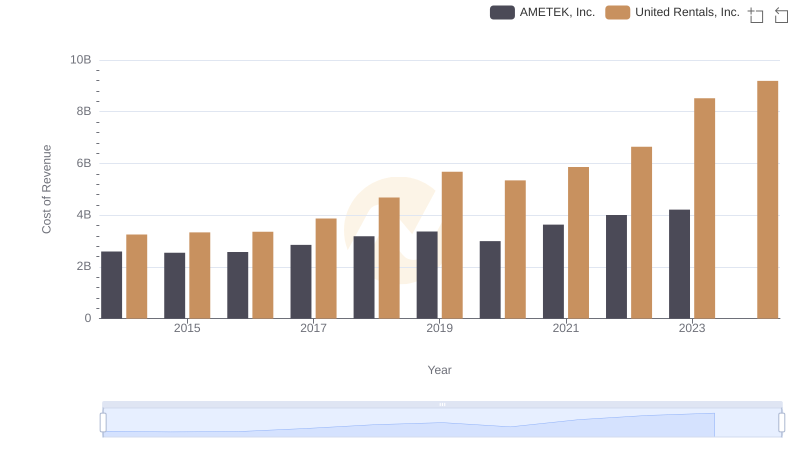
Comparing Cost of Revenue Efficiency: United Rentals, Inc. vs AMETEK, Inc.
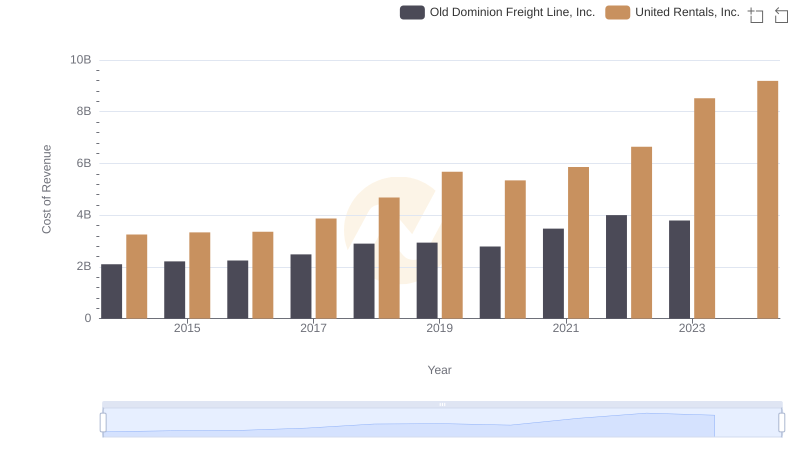
United Rentals, Inc. vs Old Dominion Freight Line, Inc.: Efficiency in Cost of Revenue Explored
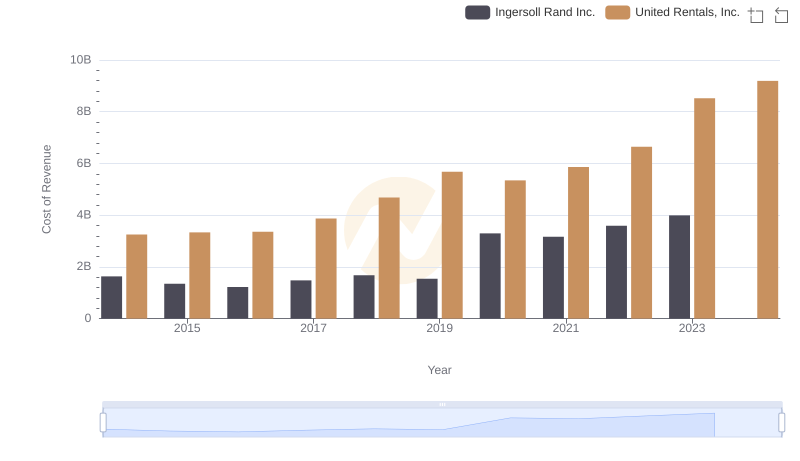
Cost of Revenue Trends: United Rentals, Inc. vs Ingersoll Rand Inc.
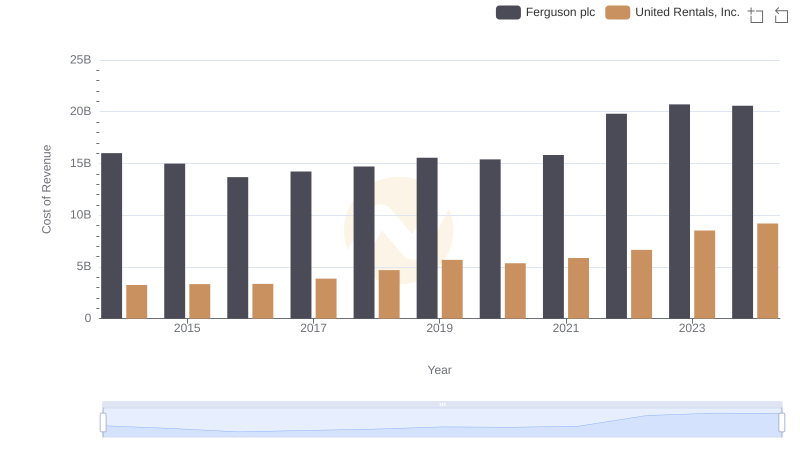
Cost of Revenue Comparison: United Rentals, Inc. vs Ferguson plc
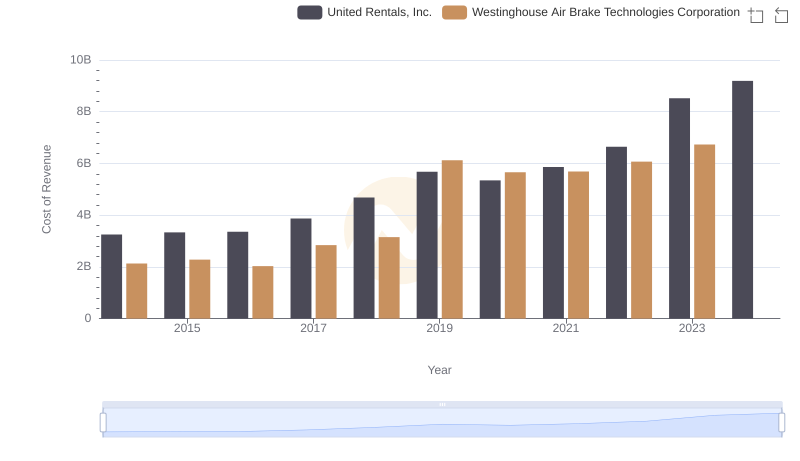
United Rentals, Inc. vs Westinghouse Air Brake Technologies Corporation: Efficiency in Cost of Revenue Explored
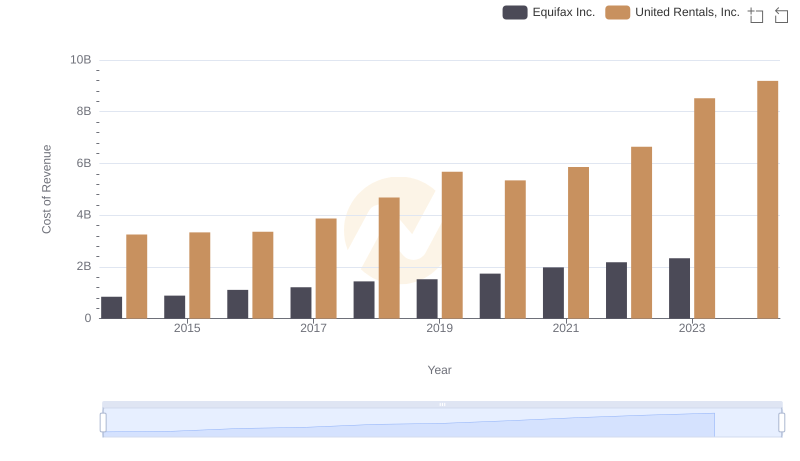
United Rentals, Inc. vs Equifax Inc.: Efficiency in Cost of Revenue Explored
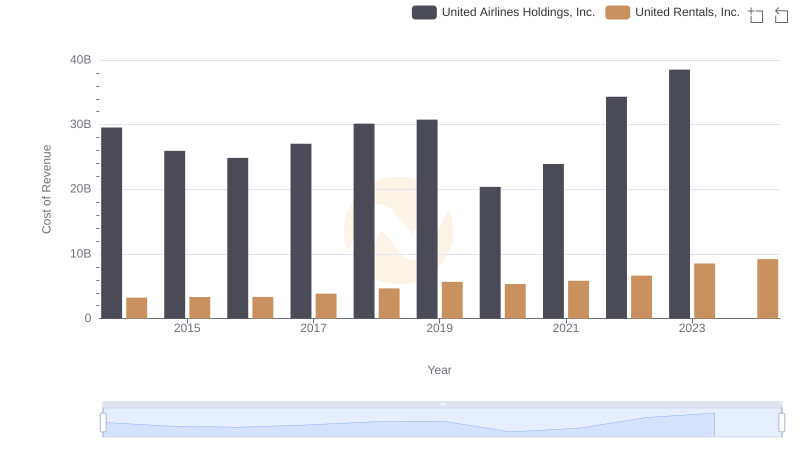
Cost Insights: Breaking Down United Rentals, Inc. and United Airlines Holdings, Inc.'s Expenses
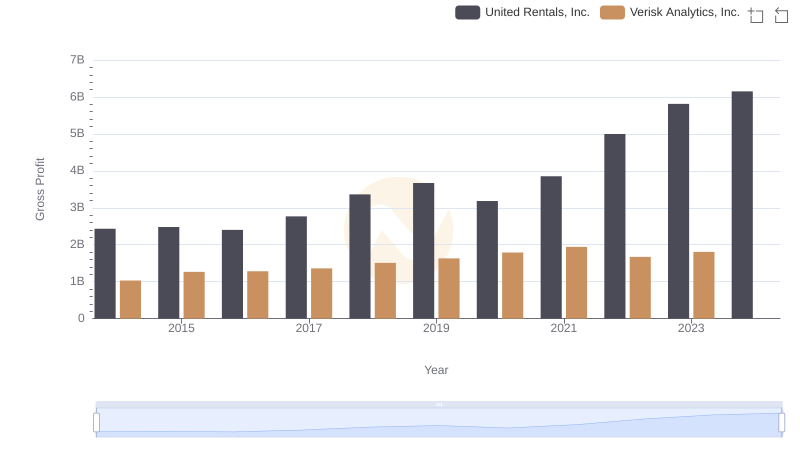
Gross Profit Trends Compared: United Rentals, Inc. vs Verisk Analytics, Inc.
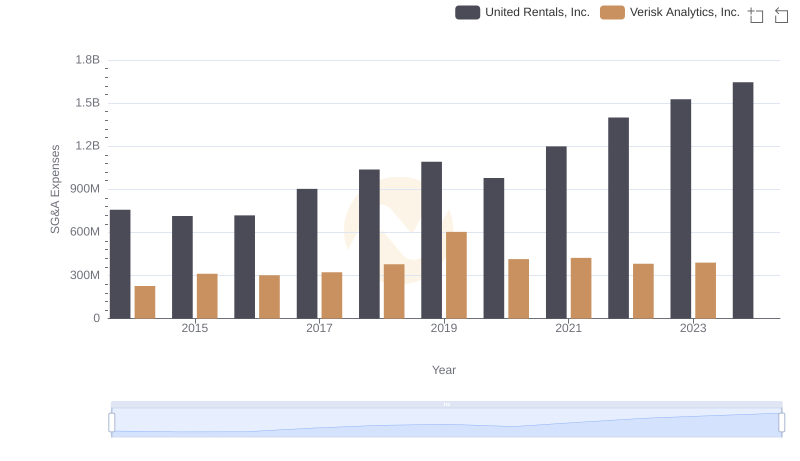
Operational Costs Compared: SG&A Analysis of United Rentals, Inc. and Verisk Analytics, Inc.
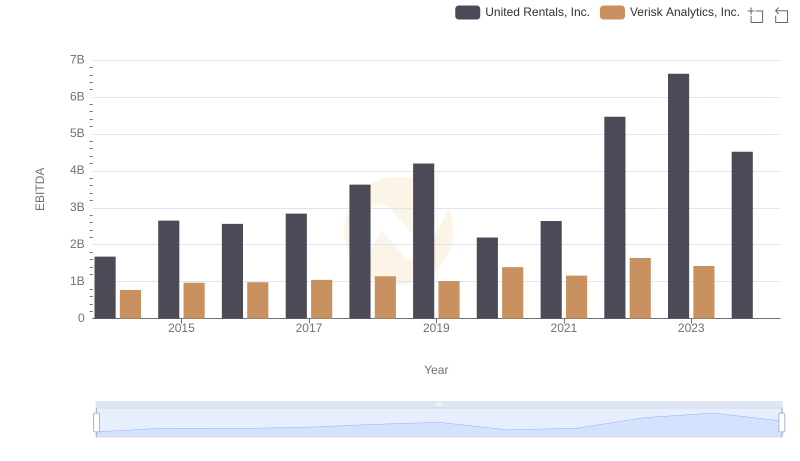
United Rentals, Inc. and Verisk Analytics, Inc.: A Detailed Examination of EBITDA Performance