| __timestamp | Quanta Services, Inc. | United Rentals, Inc. |
|---|---|---|
| Wednesday, January 1, 2014 | 6617730000 | 3253000000 |
| Thursday, January 1, 2015 | 6648771000 | 3337000000 |
| Friday, January 1, 2016 | 6637519000 | 3359000000 |
| Sunday, January 1, 2017 | 8224618000 | 3872000000 |
| Monday, January 1, 2018 | 9691459000 | 4683000000 |
| Tuesday, January 1, 2019 | 10511901000 | 5681000000 |
| Wednesday, January 1, 2020 | 9541825000 | 5347000000 |
| Friday, January 1, 2021 | 11026954000 | 5863000000 |
| Saturday, January 1, 2022 | 14544748000 | 6646000000 |
| Sunday, January 1, 2023 | 17945120000 | 8519000000 |
| Monday, January 1, 2024 | 9195000000 |
Unleashing the power of data
In the ever-evolving landscape of industrial services, understanding cost efficiency is paramount. This analysis delves into the cost of revenue trends for United Rentals, Inc. and Quanta Services, Inc. from 2014 to 2023. Over this decade, Quanta Services has consistently outpaced United Rentals in terms of cost of revenue, with a notable 171% increase from 2014 to 2023. In contrast, United Rentals saw a 162% rise in the same period.
The data reveals a significant leap for Quanta Services in 2023, reaching a peak cost of revenue, while United Rentals also marked its highest in the same year. However, the absence of data for Quanta Services in 2024 leaves room for speculation. This comparison highlights the dynamic nature of cost management strategies in the industrial sector, offering valuable insights for investors and industry analysts alike.
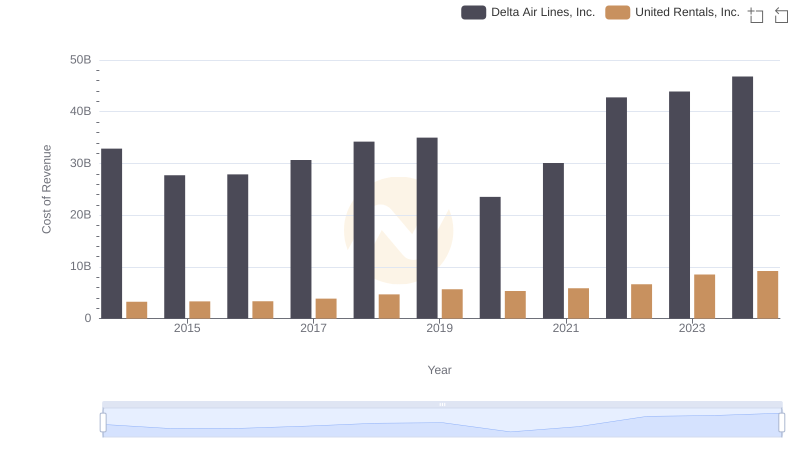
Cost Insights: Breaking Down United Rentals, Inc. and Delta Air Lines, Inc.'s Expenses
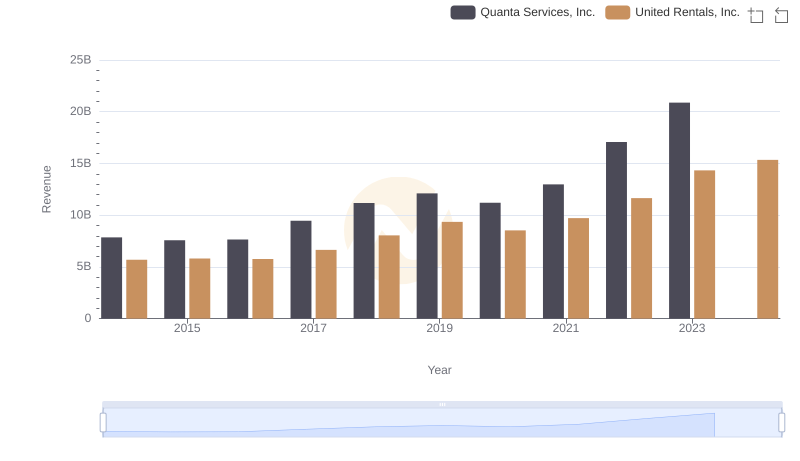
United Rentals, Inc. or Quanta Services, Inc.: Who Leads in Yearly Revenue?
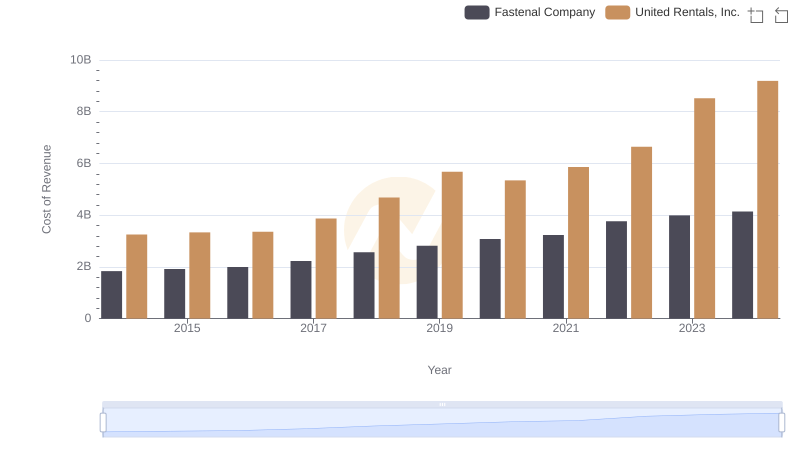
Cost Insights: Breaking Down United Rentals, Inc. and Fastenal Company's Expenses
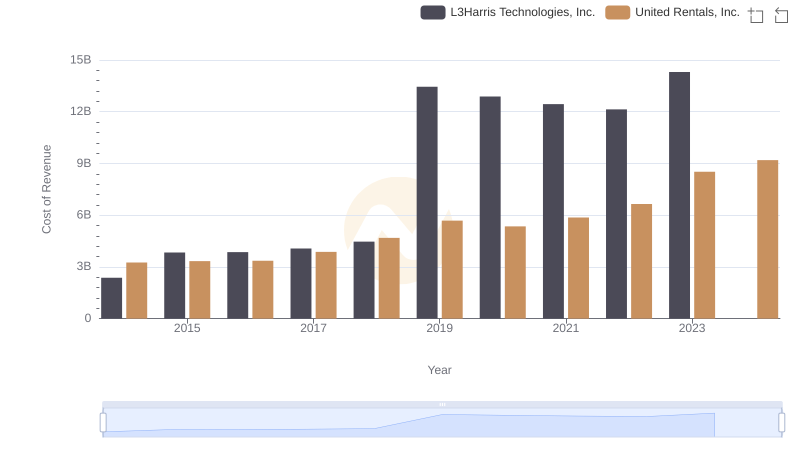
United Rentals, Inc. vs L3Harris Technologies, Inc.: Efficiency in Cost of Revenue Explored
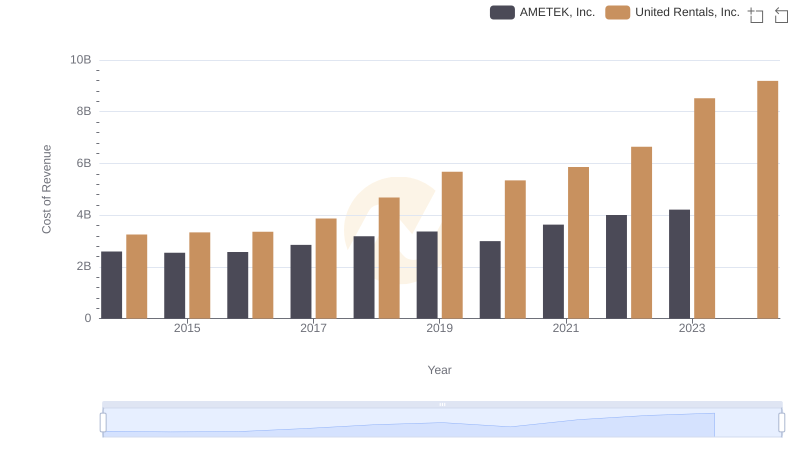
Comparing Cost of Revenue Efficiency: United Rentals, Inc. vs AMETEK, Inc.
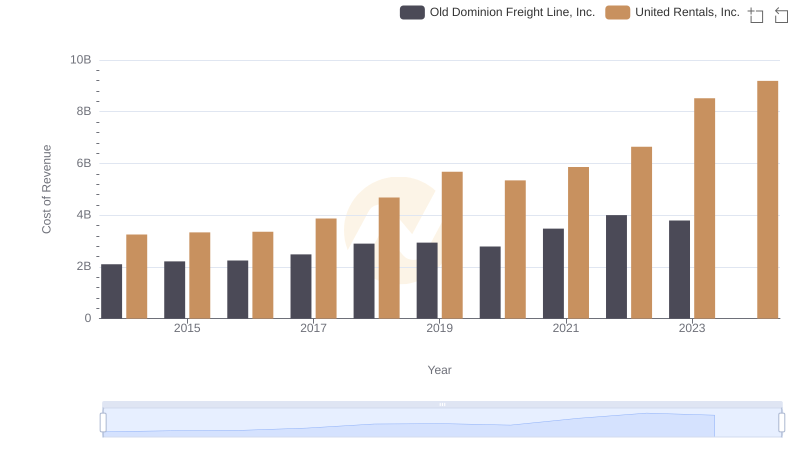
United Rentals, Inc. vs Old Dominion Freight Line, Inc.: Efficiency in Cost of Revenue Explored
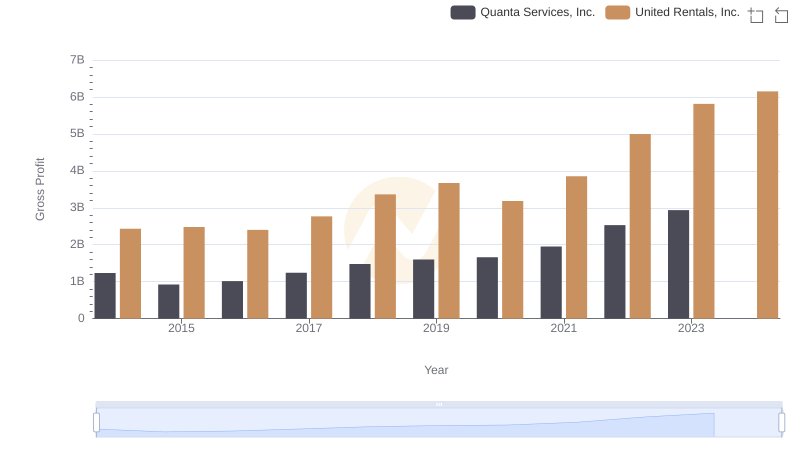
Gross Profit Comparison: United Rentals, Inc. and Quanta Services, Inc. Trends
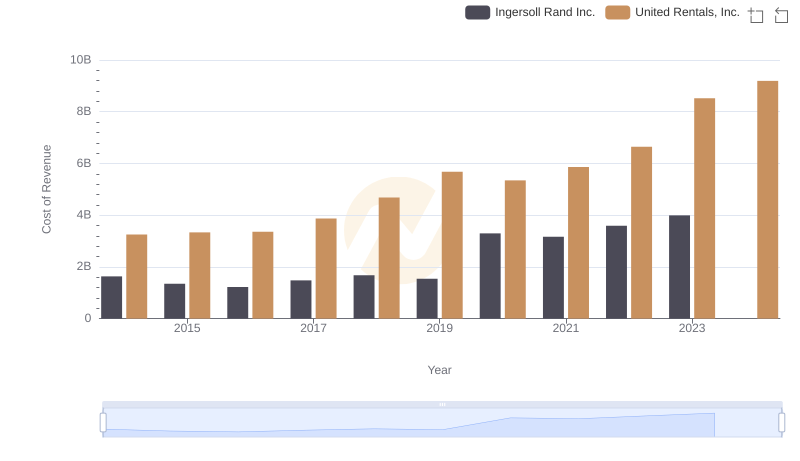
Cost of Revenue Trends: United Rentals, Inc. vs Ingersoll Rand Inc.
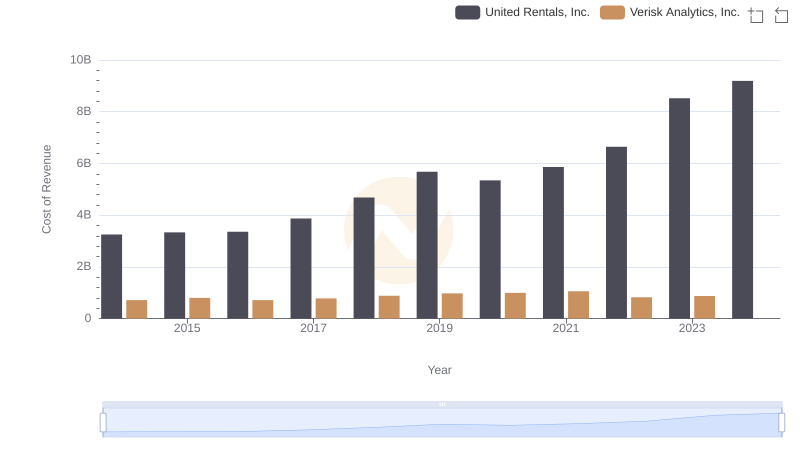
Cost of Revenue Comparison: United Rentals, Inc. vs Verisk Analytics, Inc.
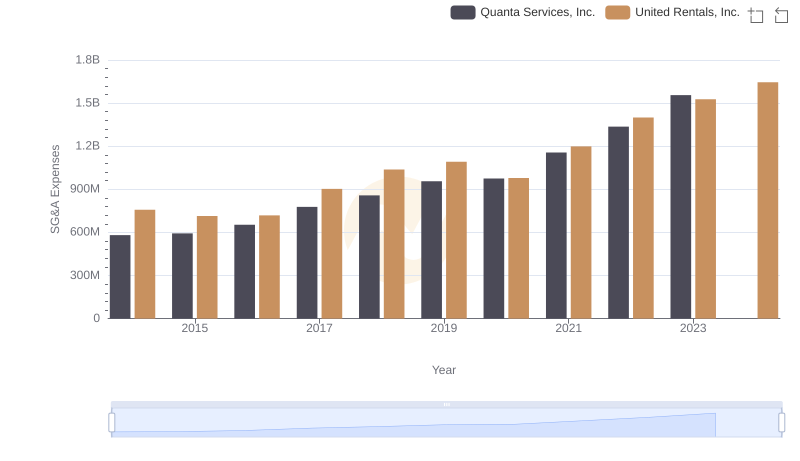
United Rentals, Inc. and Quanta Services, Inc.: SG&A Spending Patterns Compared
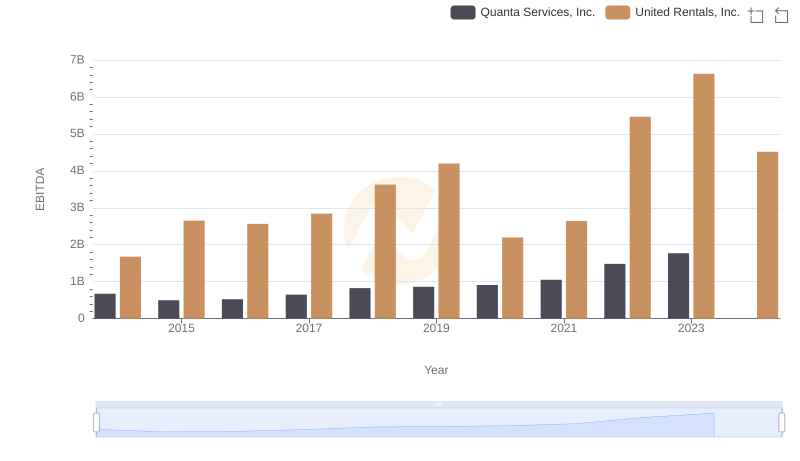
Comprehensive EBITDA Comparison: United Rentals, Inc. vs Quanta Services, Inc.