| __timestamp | United Rentals, Inc. | Verisk Analytics, Inc. |
|---|---|---|
| Wednesday, January 1, 2014 | 5685000000 | 1746726000 |
| Thursday, January 1, 2015 | 5817000000 | 2068010000 |
| Friday, January 1, 2016 | 5762000000 | 1995200000 |
| Sunday, January 1, 2017 | 6641000000 | 2145200000 |
| Monday, January 1, 2018 | 8047000000 | 2395100000 |
| Tuesday, January 1, 2019 | 9351000000 | 2607100000 |
| Wednesday, January 1, 2020 | 8530000000 | 2784600000 |
| Friday, January 1, 2021 | 9716000000 | 2998600000 |
| Saturday, January 1, 2022 | 11642000000 | 2497000000 |
| Sunday, January 1, 2023 | 14332000000 | 2681400000 |
| Monday, January 1, 2024 | 15345000000 |
In pursuit of knowledge
In the dynamic world of business, United Rentals, Inc. and Verisk Analytics, Inc. have showcased intriguing revenue trajectories over the past decade. United Rentals, Inc., a leader in equipment rental, has seen its revenue soar by approximately 170% from 2014 to 2023, reflecting its robust market expansion and strategic acquisitions. In contrast, Verisk Analytics, Inc., a data analytics powerhouse, experienced a steady revenue increase of around 54% during the same period, underscoring its consistent growth in the analytics sector.
United Rentals' revenue peaked in 2023, marking a significant leap from its 2014 figures, while Verisk Analytics maintained a stable upward trend, albeit with a slight dip in 2022. The data for 2024 remains incomplete, highlighting the need for ongoing analysis. This comparison not only illustrates the diverse growth strategies of these companies but also offers valuable insights into their respective industries.
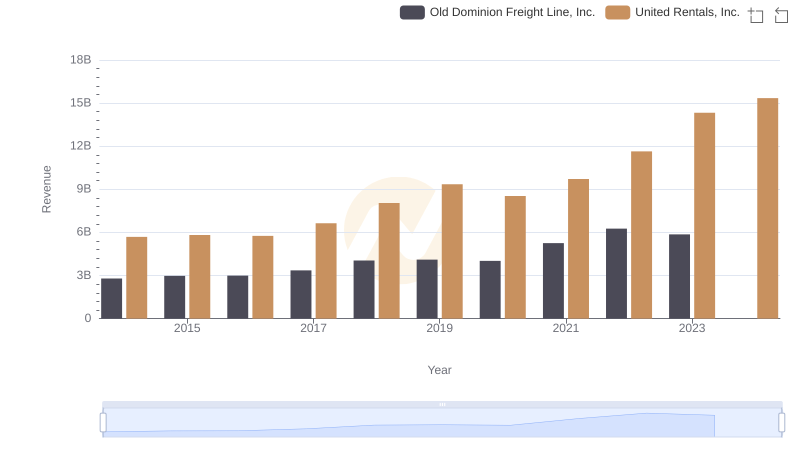
Who Generates More Revenue? United Rentals, Inc. or Old Dominion Freight Line, Inc.
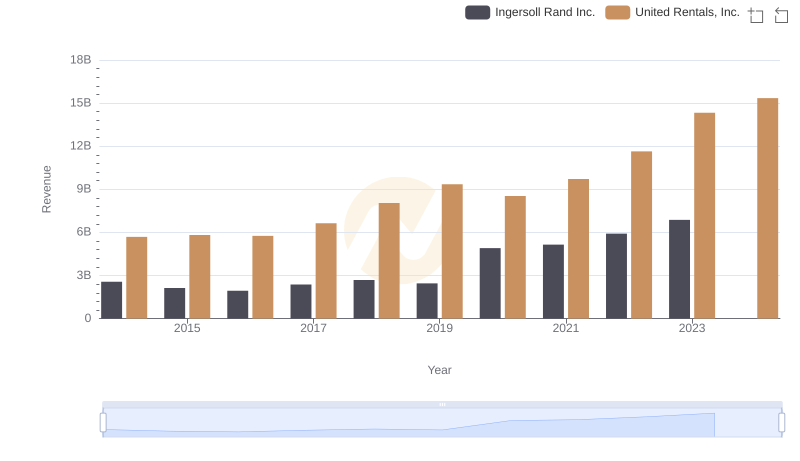
United Rentals, Inc. vs Ingersoll Rand Inc.: Examining Key Revenue Metrics
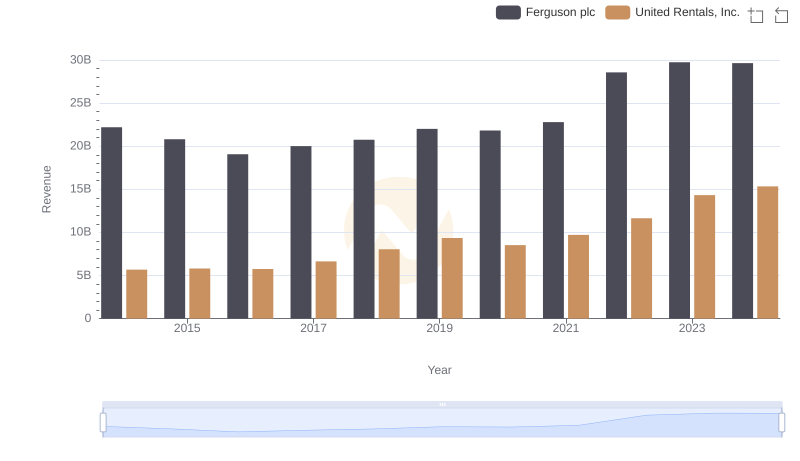
United Rentals, Inc. or Ferguson plc: Who Leads in Yearly Revenue?
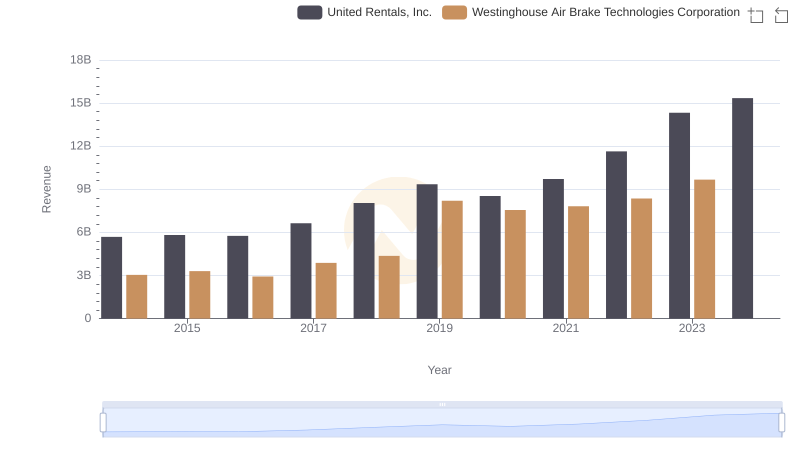
United Rentals, Inc. and Westinghouse Air Brake Technologies Corporation: A Comprehensive Revenue Analysis
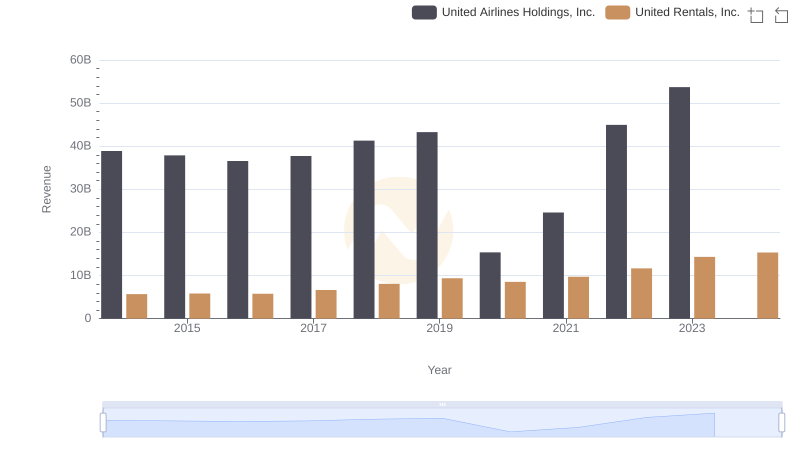
United Rentals, Inc. vs United Airlines Holdings, Inc.: Examining Key Revenue Metrics
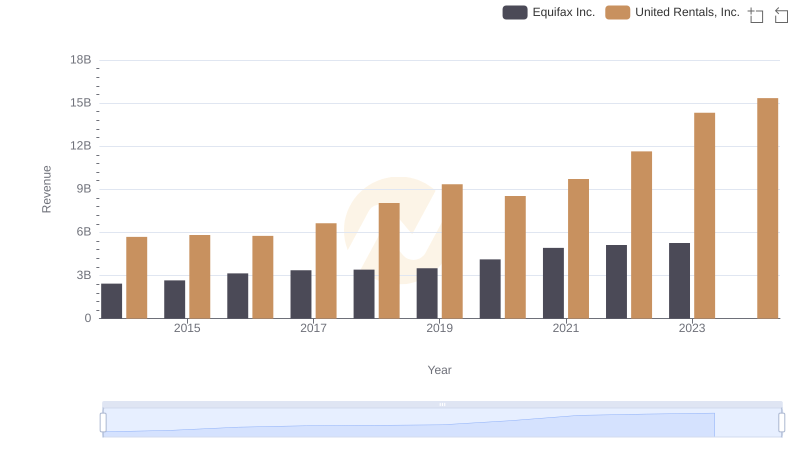
United Rentals, Inc. vs Equifax Inc.: Annual Revenue Growth Compared
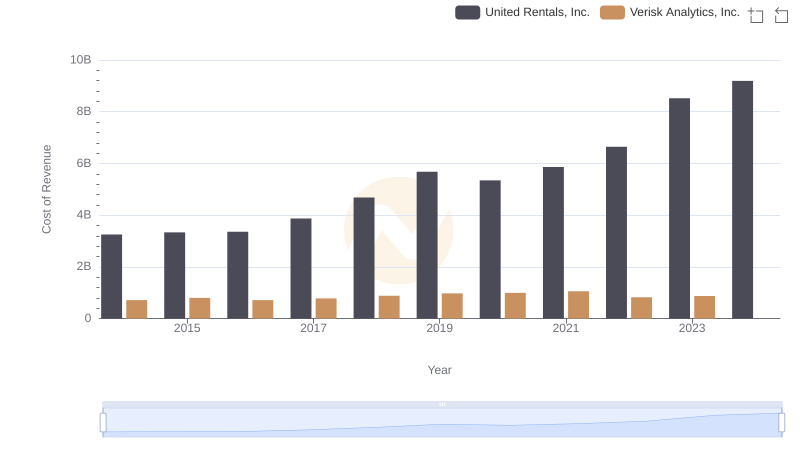
Cost of Revenue Comparison: United Rentals, Inc. vs Verisk Analytics, Inc.
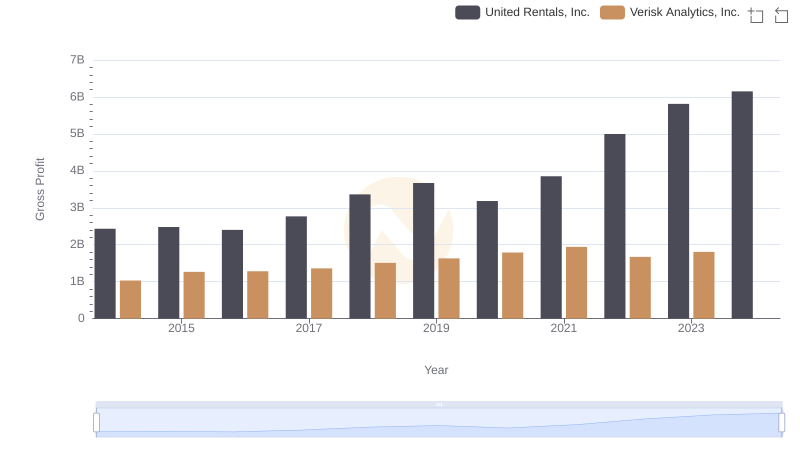
Gross Profit Trends Compared: United Rentals, Inc. vs Verisk Analytics, Inc.
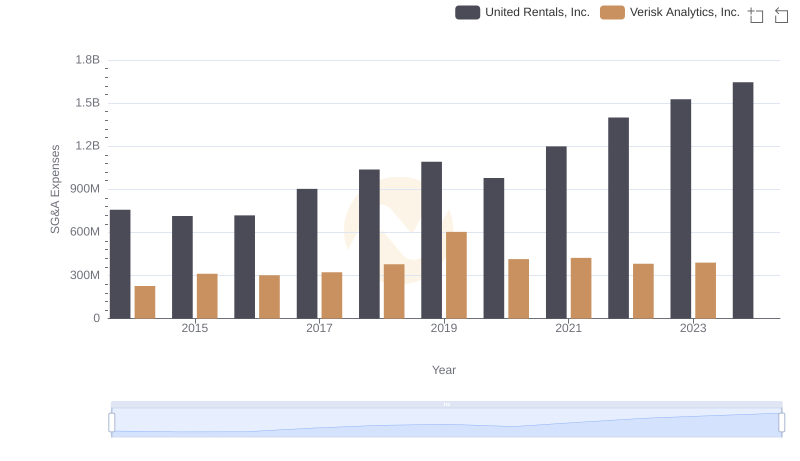
Operational Costs Compared: SG&A Analysis of United Rentals, Inc. and Verisk Analytics, Inc.
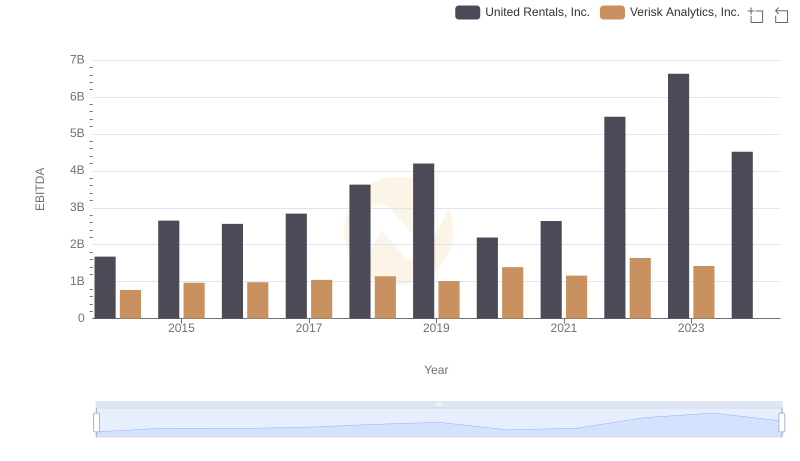
United Rentals, Inc. and Verisk Analytics, Inc.: A Detailed Examination of EBITDA Performance