| __timestamp | Old Dominion Freight Line, Inc. | United Rentals, Inc. |
|---|---|---|
| Wednesday, January 1, 2014 | 2100409000 | 3253000000 |
| Thursday, January 1, 2015 | 2214943000 | 3337000000 |
| Friday, January 1, 2016 | 2246890000 | 3359000000 |
| Sunday, January 1, 2017 | 2482732000 | 3872000000 |
| Monday, January 1, 2018 | 2899452000 | 4683000000 |
| Tuesday, January 1, 2019 | 2938895000 | 5681000000 |
| Wednesday, January 1, 2020 | 2786531000 | 5347000000 |
| Friday, January 1, 2021 | 3481268000 | 5863000000 |
| Saturday, January 1, 2022 | 4003951000 | 6646000000 |
| Sunday, January 1, 2023 | 3793953000 | 8519000000 |
| Monday, January 1, 2024 | 9195000000 |
Unleashing insights
In the ever-evolving landscape of logistics and equipment rental, understanding cost efficiency is paramount. This analysis delves into the cost of revenue trends for Old Dominion Freight Line, Inc. and United Rentals, Inc. from 2014 to 2023. Over this period, United Rentals consistently outpaced Old Dominion in cost of revenue, with a notable 162% increase from 2014 to 2023. In contrast, Old Dominion saw an 81% rise, highlighting different growth trajectories.
This data underscores the dynamic nature of these industries, where strategic decisions significantly impact financial outcomes.
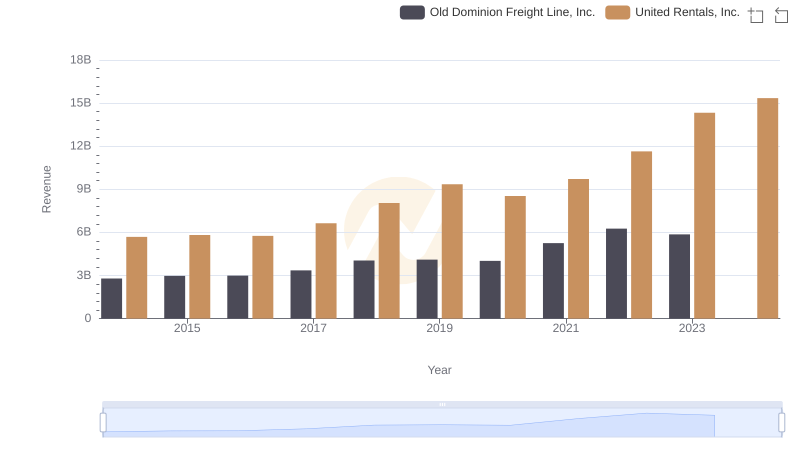
Who Generates More Revenue? United Rentals, Inc. or Old Dominion Freight Line, Inc.
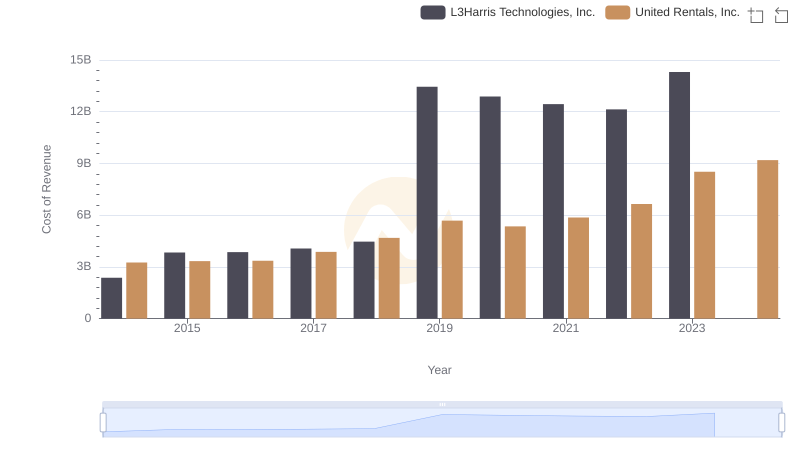
United Rentals, Inc. vs L3Harris Technologies, Inc.: Efficiency in Cost of Revenue Explored
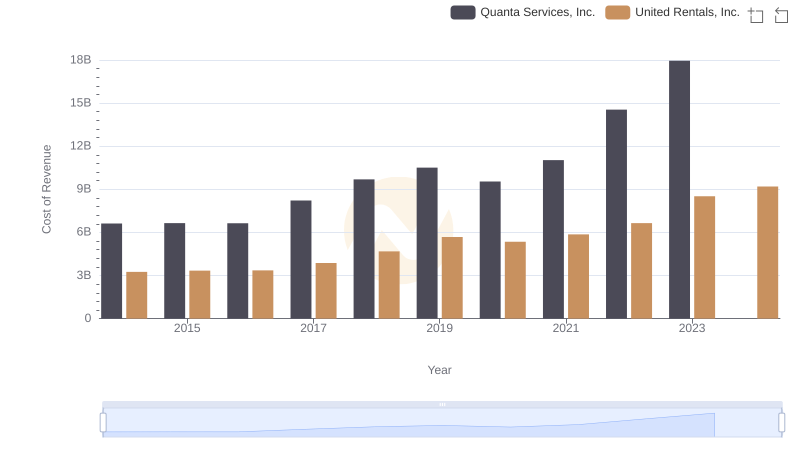
United Rentals, Inc. vs Quanta Services, Inc.: Efficiency in Cost of Revenue Explored
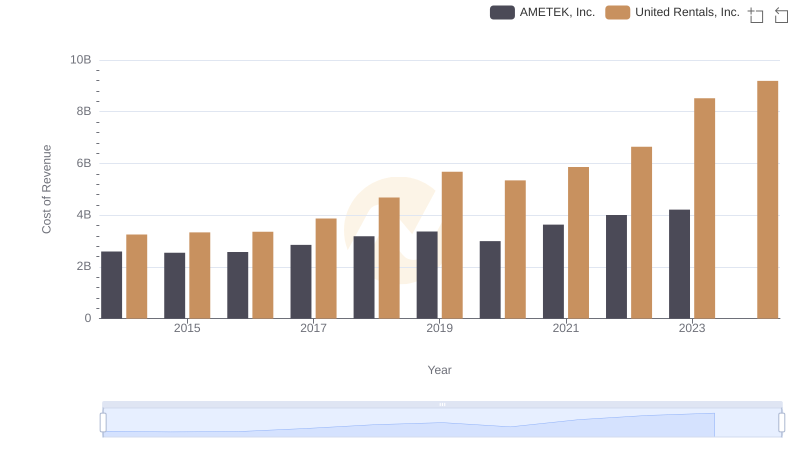
Comparing Cost of Revenue Efficiency: United Rentals, Inc. vs AMETEK, Inc.
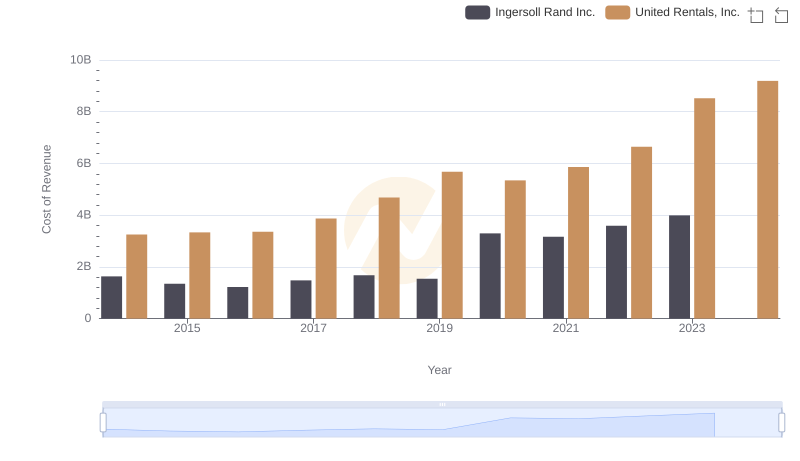
Cost of Revenue Trends: United Rentals, Inc. vs Ingersoll Rand Inc.
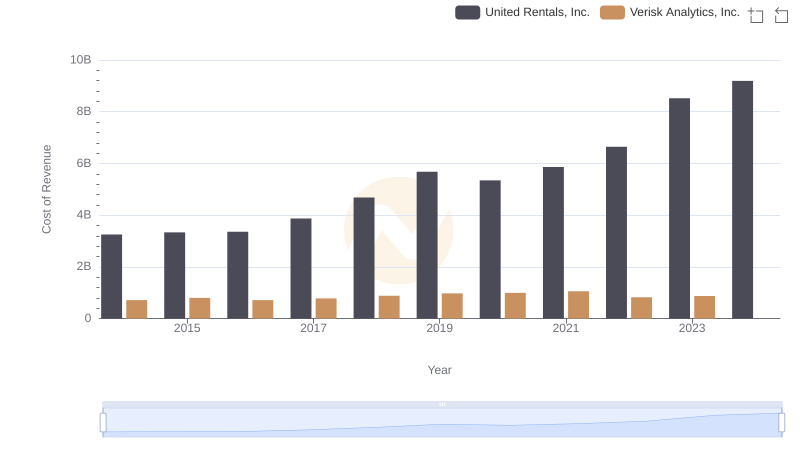
Cost of Revenue Comparison: United Rentals, Inc. vs Verisk Analytics, Inc.
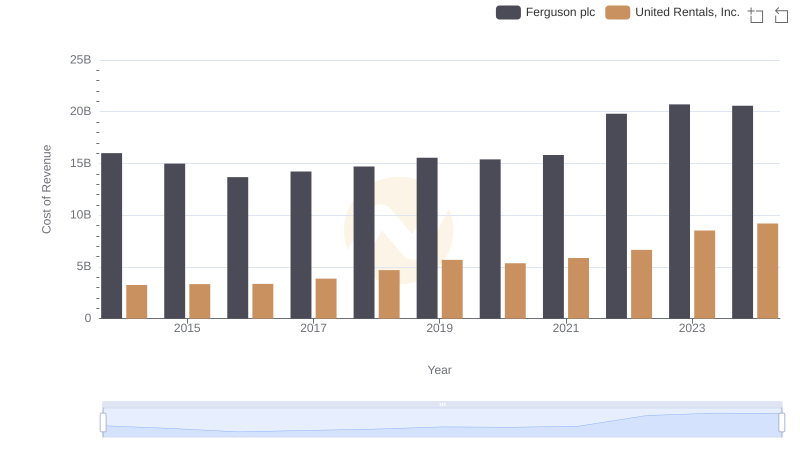
Cost of Revenue Comparison: United Rentals, Inc. vs Ferguson plc
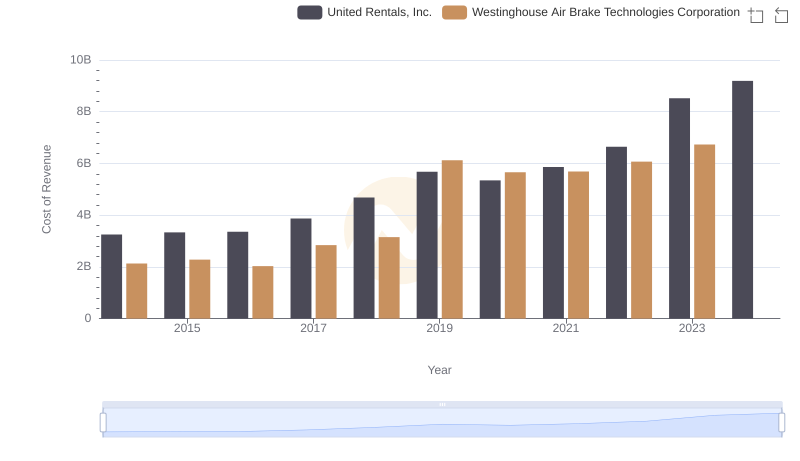
United Rentals, Inc. vs Westinghouse Air Brake Technologies Corporation: Efficiency in Cost of Revenue Explored
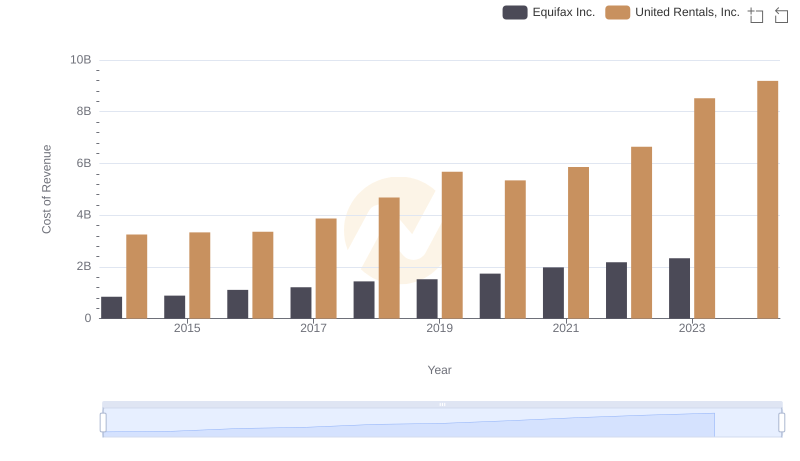
United Rentals, Inc. vs Equifax Inc.: Efficiency in Cost of Revenue Explored
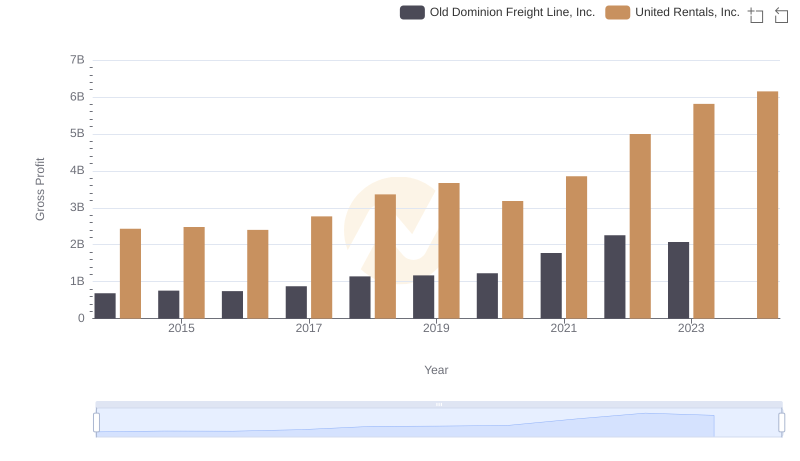
Gross Profit Comparison: United Rentals, Inc. and Old Dominion Freight Line, Inc. Trends
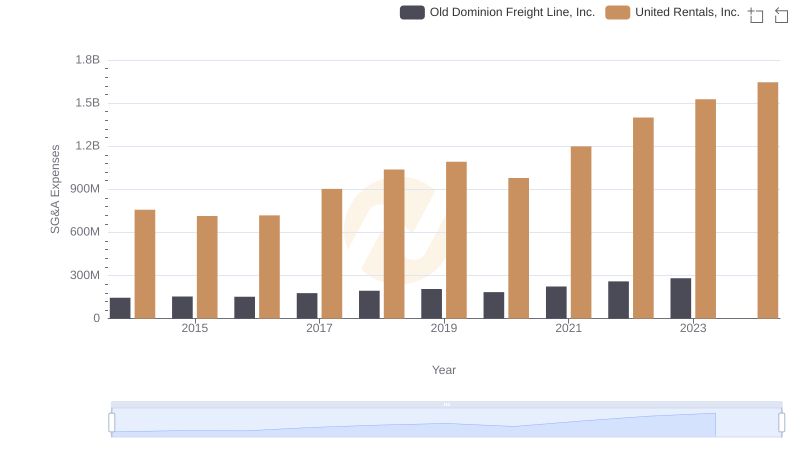
Cost Management Insights: SG&A Expenses for United Rentals, Inc. and Old Dominion Freight Line, Inc.
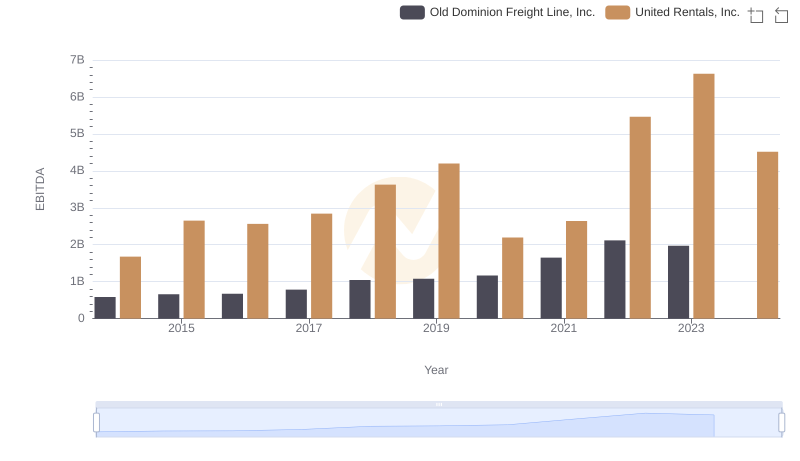
Professional EBITDA Benchmarking: United Rentals, Inc. vs Old Dominion Freight Line, Inc.