| __timestamp | Ferguson plc | United Rentals, Inc. |
|---|---|---|
| Wednesday, January 1, 2014 | 15995739428 | 3253000000 |
| Thursday, January 1, 2015 | 14984241894 | 3337000000 |
| Friday, January 1, 2016 | 13677144858 | 3359000000 |
| Sunday, January 1, 2017 | 14215866673 | 3872000000 |
| Monday, January 1, 2018 | 14708000000 | 4683000000 |
| Tuesday, January 1, 2019 | 15552000000 | 5681000000 |
| Wednesday, January 1, 2020 | 15398000000 | 5347000000 |
| Friday, January 1, 2021 | 15812000000 | 5863000000 |
| Saturday, January 1, 2022 | 19810000000 | 6646000000 |
| Sunday, January 1, 2023 | 20709000000 | 8519000000 |
| Monday, January 1, 2024 | 20582000000 | 9195000000 |
Igniting the spark of knowledge
In the competitive landscape of industrial services, United Rentals, Inc. and Ferguson plc stand as titans. Over the past decade, Ferguson plc has consistently outpaced United Rentals in terms of cost of revenue, with figures peaking at approximately $20.7 billion in 2023. This represents a 30% increase from 2014. Meanwhile, United Rentals has shown a robust growth trajectory, with its cost of revenue surging by nearly 180% from 2014 to 2023, reaching around $8.5 billion.
From 2014 to 2023, both companies have demonstrated resilience and adaptability. Ferguson's cost of revenue grew steadily, reflecting its strategic expansions and market dominance. United Rentals, on the other hand, showcased a more aggressive growth pattern, particularly from 2018 onwards, indicating its successful ventures and market penetration strategies.
As we look to the future, these trends suggest a dynamic shift in the industrial services sector, with both companies poised for further growth and innovation.
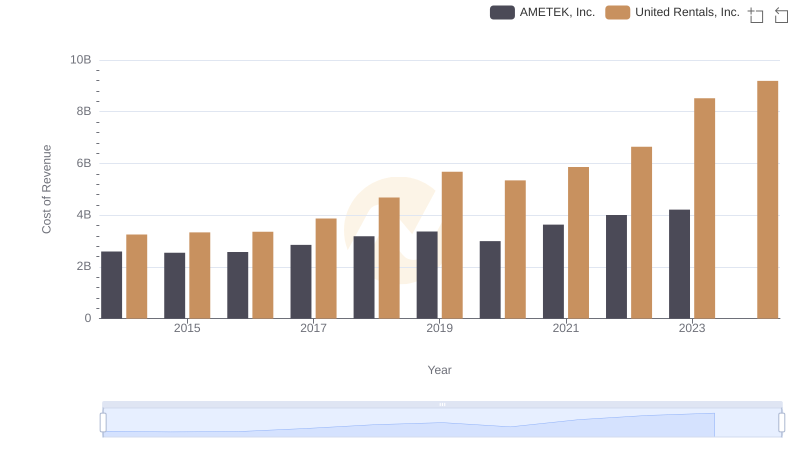
Comparing Cost of Revenue Efficiency: United Rentals, Inc. vs AMETEK, Inc.
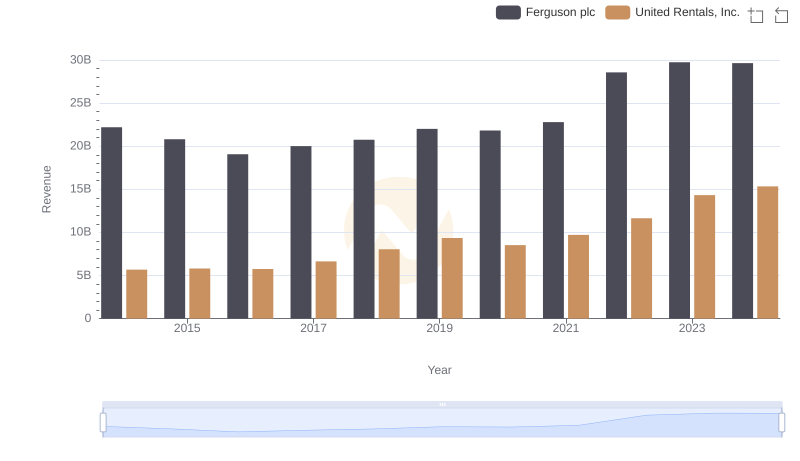
United Rentals, Inc. or Ferguson plc: Who Leads in Yearly Revenue?
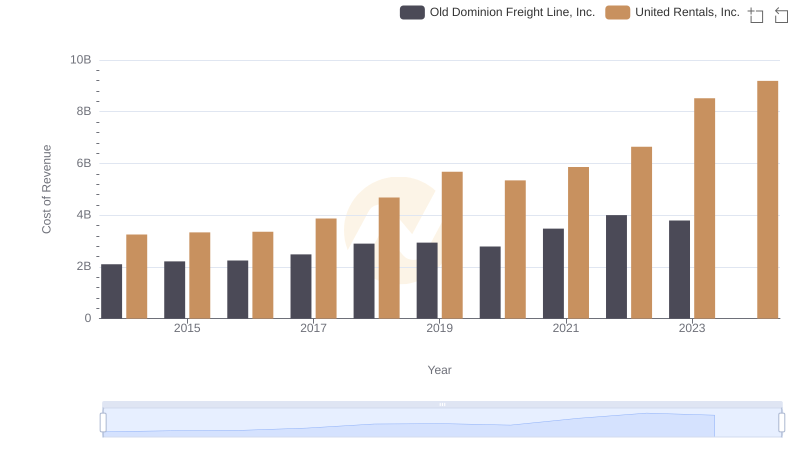
United Rentals, Inc. vs Old Dominion Freight Line, Inc.: Efficiency in Cost of Revenue Explored
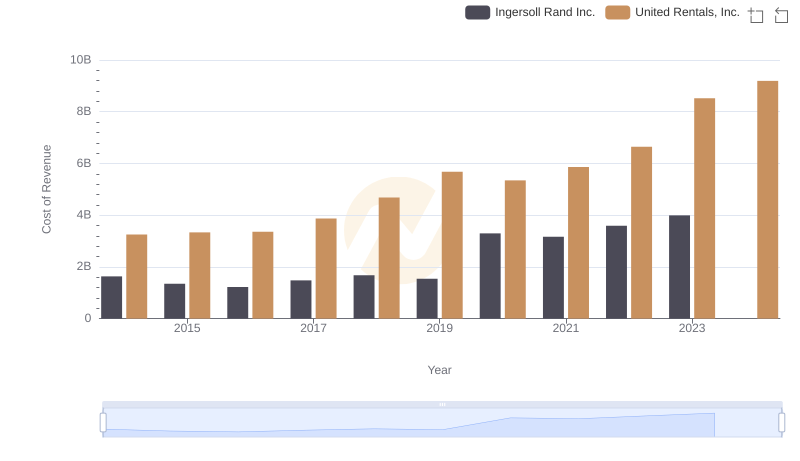
Cost of Revenue Trends: United Rentals, Inc. vs Ingersoll Rand Inc.
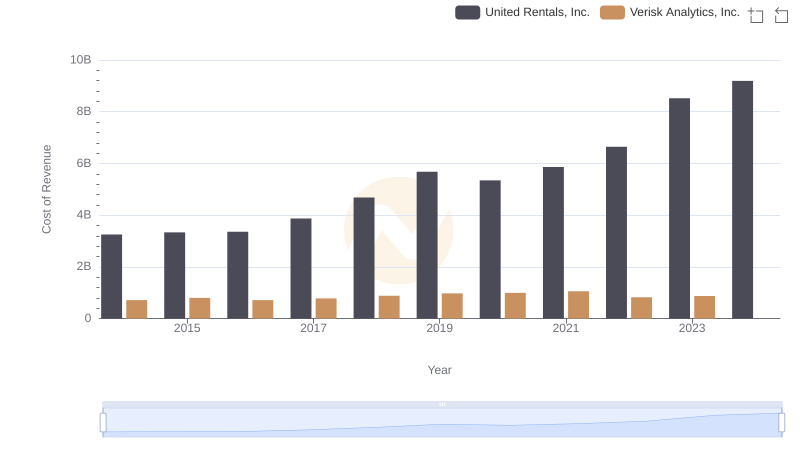
Cost of Revenue Comparison: United Rentals, Inc. vs Verisk Analytics, Inc.
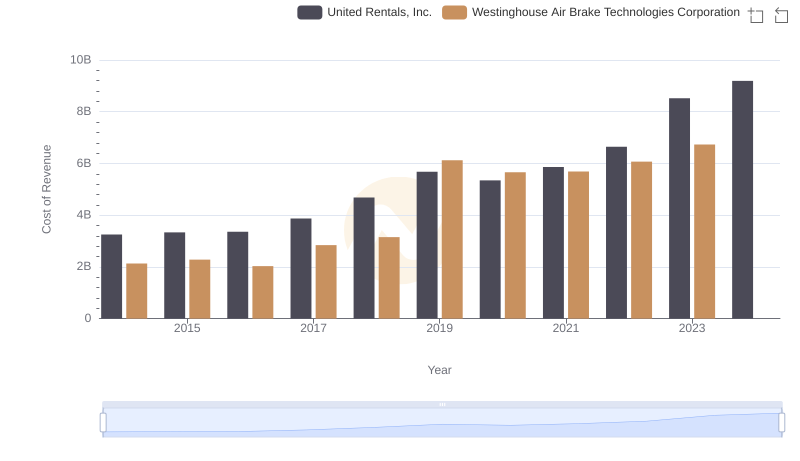
United Rentals, Inc. vs Westinghouse Air Brake Technologies Corporation: Efficiency in Cost of Revenue Explored
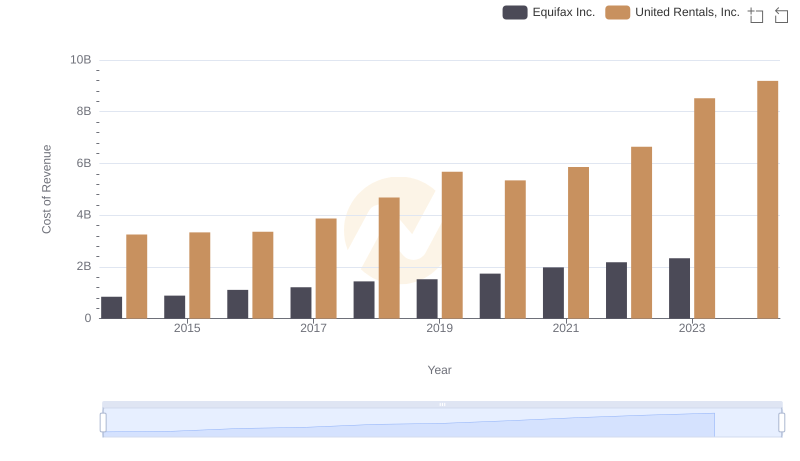
United Rentals, Inc. vs Equifax Inc.: Efficiency in Cost of Revenue Explored
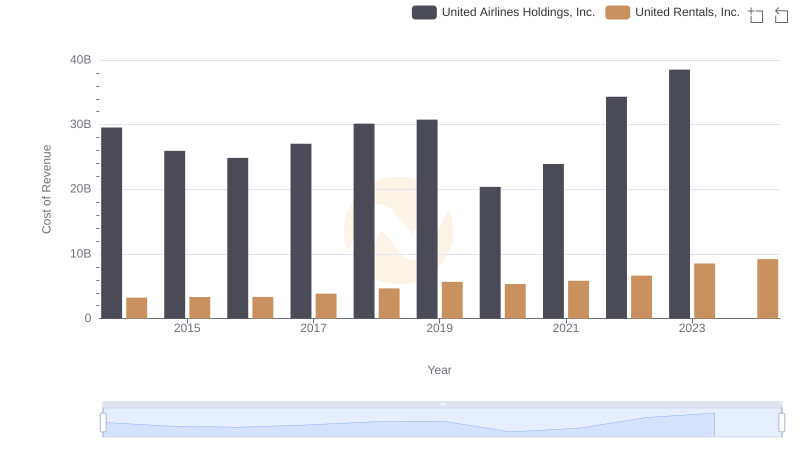
Cost Insights: Breaking Down United Rentals, Inc. and United Airlines Holdings, Inc.'s Expenses
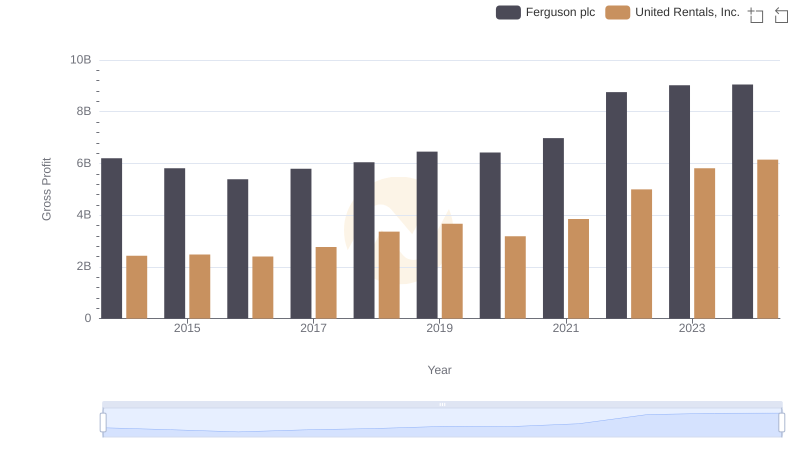
Key Insights on Gross Profit: United Rentals, Inc. vs Ferguson plc
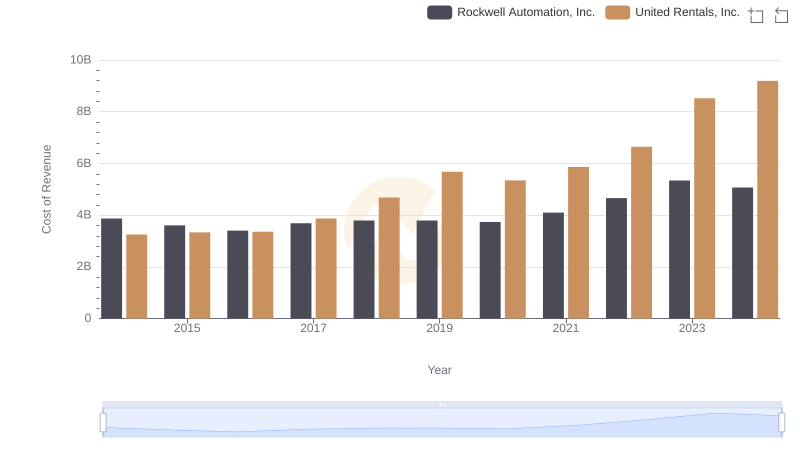
Cost of Revenue Comparison: United Rentals, Inc. vs Rockwell Automation, Inc.
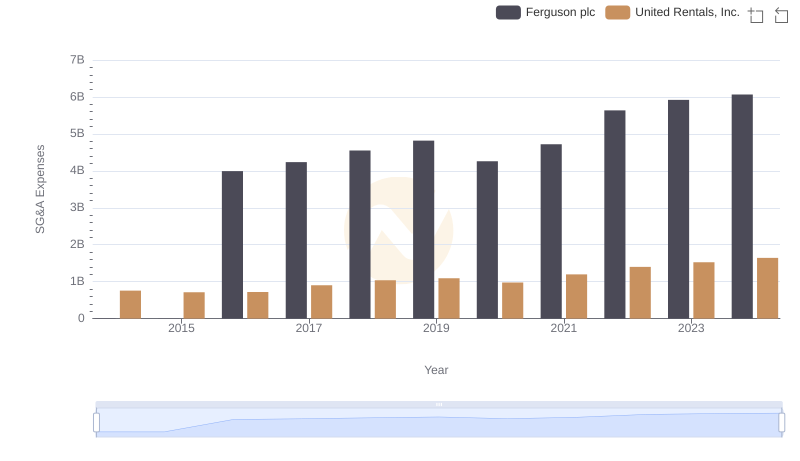
Comparing SG&A Expenses: United Rentals, Inc. vs Ferguson plc Trends and Insights
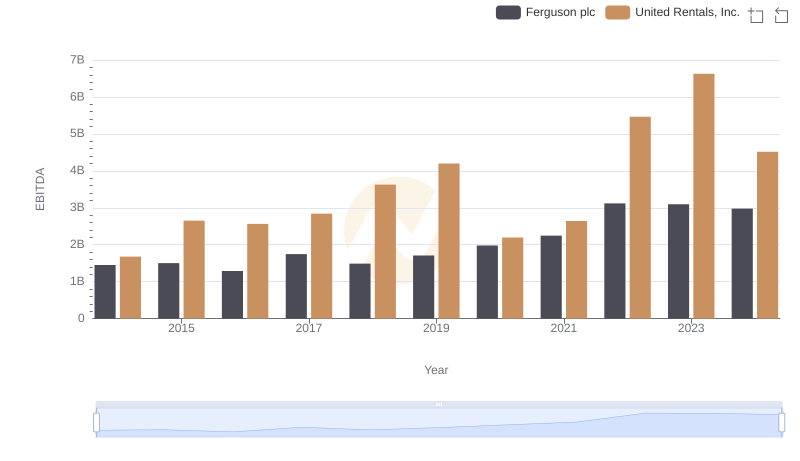
Comprehensive EBITDA Comparison: United Rentals, Inc. vs Ferguson plc