| __timestamp | United Rentals, Inc. | Verisk Analytics, Inc. |
|---|---|---|
| Wednesday, January 1, 2014 | 1678000000 | 776000000 |
| Thursday, January 1, 2015 | 2653000000 | 972500000 |
| Friday, January 1, 2016 | 2566000000 | 985300000 |
| Sunday, January 1, 2017 | 2843000000 | 1047800000 |
| Monday, January 1, 2018 | 3628000000 | 1145500000 |
| Tuesday, January 1, 2019 | 4200000000 | 1018900000 |
| Wednesday, January 1, 2020 | 2195000000 | 1393800000 |
| Friday, January 1, 2021 | 2642000000 | 1163700000 |
| Saturday, January 1, 2022 | 5464000000 | 1639800000 |
| Sunday, January 1, 2023 | 6627000000 | 1424100000 |
| Monday, January 1, 2024 | 4516000000 |
In pursuit of knowledge
In the ever-evolving landscape of corporate finance, EBITDA serves as a crucial indicator of a company's operational performance. From 2014 to 2023, United Rentals, Inc. and Verisk Analytics, Inc. have showcased intriguing trajectories in their EBITDA figures. United Rentals has demonstrated a robust growth, with its EBITDA surging by nearly 295% over the decade, peaking in 2023. This growth reflects the company's strategic expansions and market adaptability. In contrast, Verisk Analytics has maintained a steady yet modest growth, with its EBITDA increasing by approximately 84% during the same period. Notably, 2020 marked a challenging year for both companies, with United Rentals experiencing a significant dip, while Verisk Analytics saw a temporary spike. As we look to the future, the absence of data for Verisk Analytics in 2024 leaves room for speculation on its next strategic move.
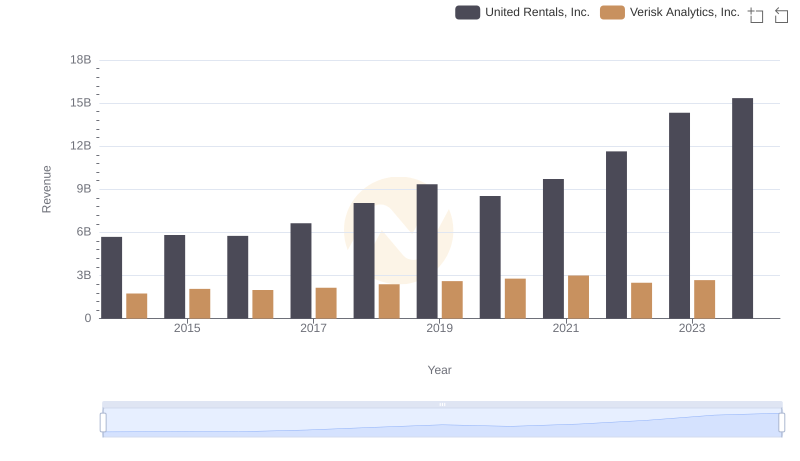
Revenue Insights: United Rentals, Inc. and Verisk Analytics, Inc. Performance Compared
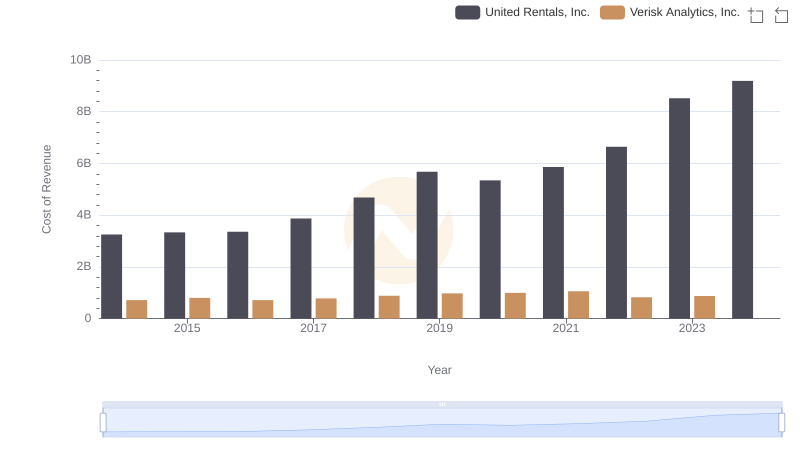
Cost of Revenue Comparison: United Rentals, Inc. vs Verisk Analytics, Inc.
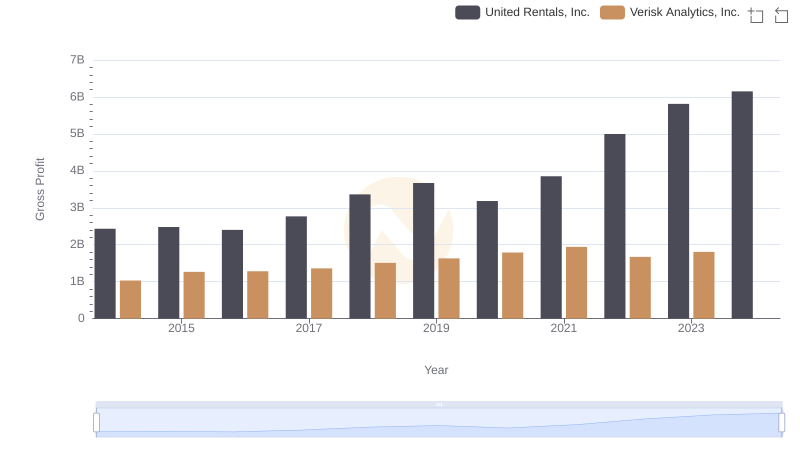
Gross Profit Trends Compared: United Rentals, Inc. vs Verisk Analytics, Inc.
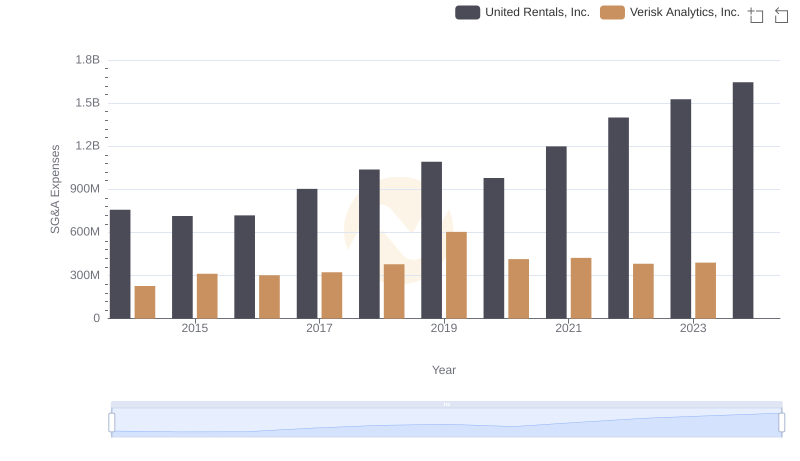
Operational Costs Compared: SG&A Analysis of United Rentals, Inc. and Verisk Analytics, Inc.
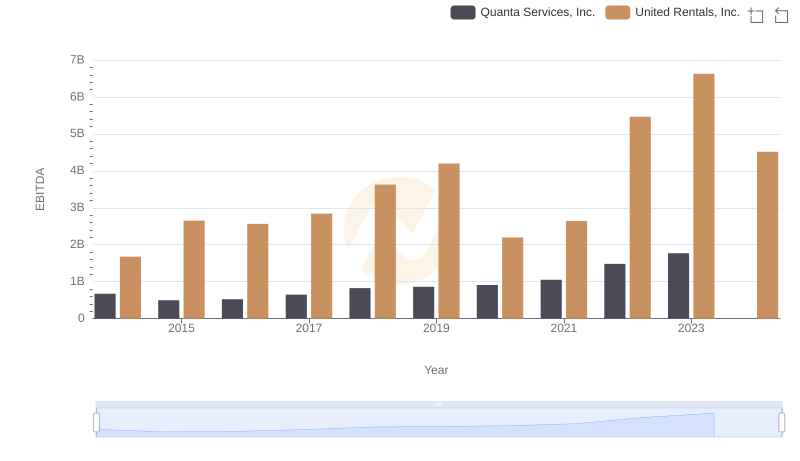
Comprehensive EBITDA Comparison: United Rentals, Inc. vs Quanta Services, Inc.
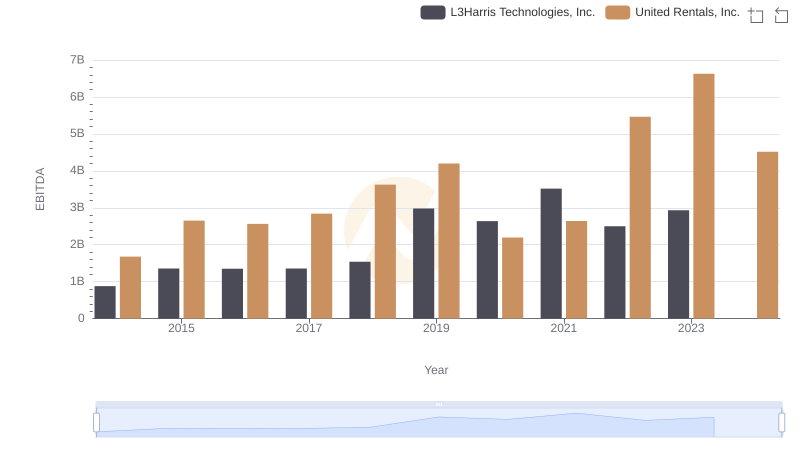
A Professional Review of EBITDA: United Rentals, Inc. Compared to L3Harris Technologies, Inc.
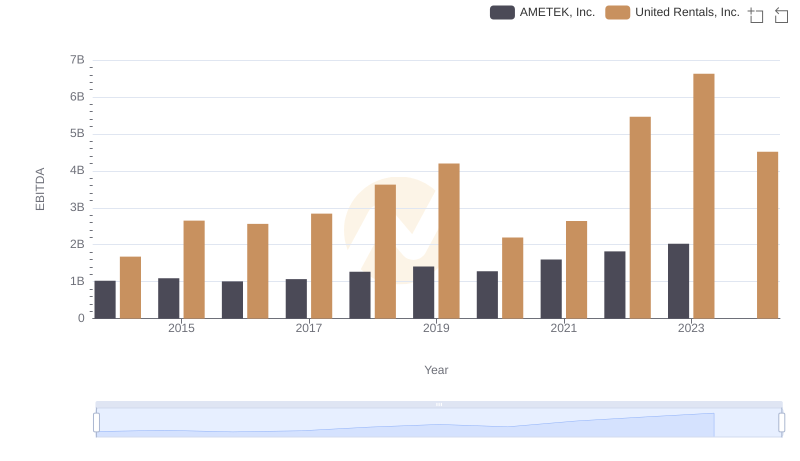
A Side-by-Side Analysis of EBITDA: United Rentals, Inc. and AMETEK, Inc.
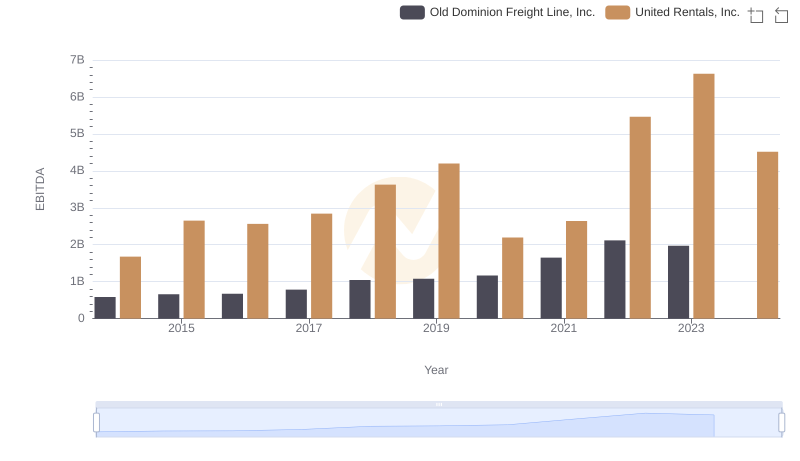
Professional EBITDA Benchmarking: United Rentals, Inc. vs Old Dominion Freight Line, Inc.
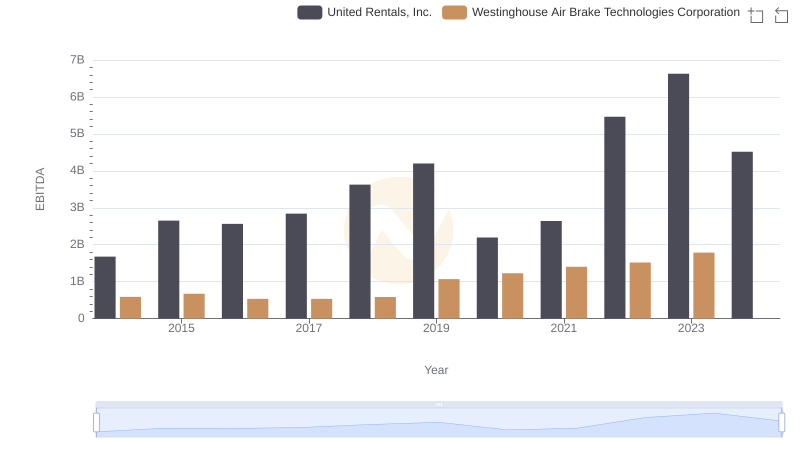
EBITDA Analysis: Evaluating United Rentals, Inc. Against Westinghouse Air Brake Technologies Corporation
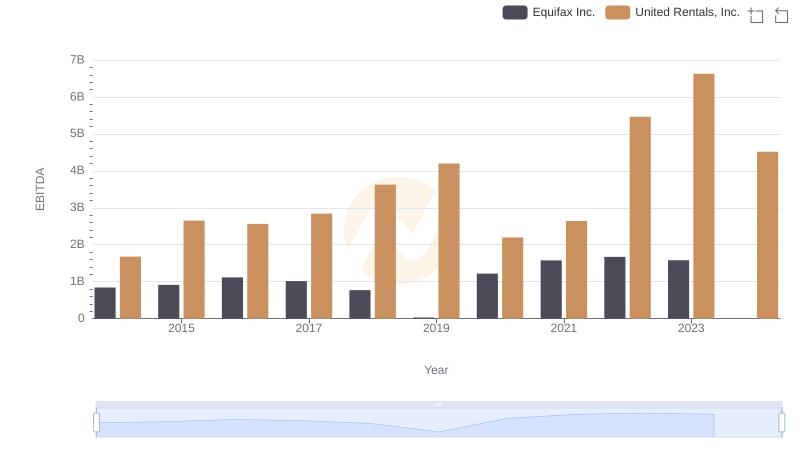
EBITDA Performance Review: United Rentals, Inc. vs Equifax Inc.
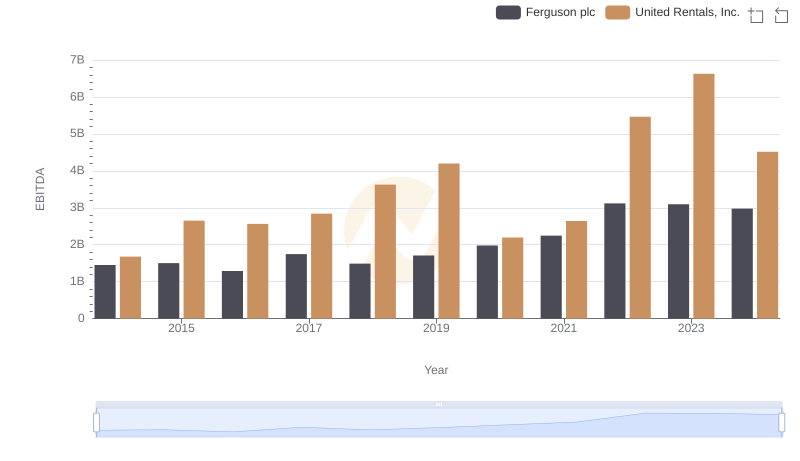
Comprehensive EBITDA Comparison: United Rentals, Inc. vs Ferguson plc
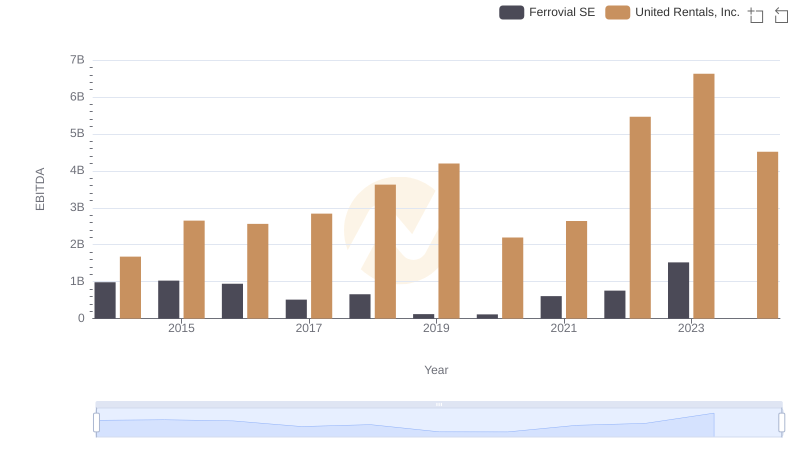
United Rentals, Inc. vs Ferrovial SE: In-Depth EBITDA Performance Comparison